Gold continues its uptrend from a high price zone, with attention on how to interpret the weight of real interest rates amid a weaker dollar.
① This week’s one-sentence summary
This week, gold rose from $4,430.0 at the beginning of the week to $4,516.8 on September 4th, a weekly increase of +1.9594%. While the price action appears strong, the interpretation is not straightforward. The closing price is in the high range, at the 87.28 percentile over the past 3 years, and the 20-day annualized volatility has risen to 22.91%, also the 78.66 percentile over the past 3 years. On the other hand, the DXY is low, at the 7.65 percentile over the past 3 years, which supports the dollar and, consequently, gold. Conversely, the US 10-year real interest rate proxy is at 2.45%, the 99.06 percentile over the past 3 years, and is considerably heavy. Therefore, the focus this week is not on the strength of "chasing higher highs," but rather how much the tailwind of a weaker dollar can absorb the headwind of real interest rates.
② Price Trends and Chart Review
This week’s gold price data is from the yfinance futures series, with daily bars following the source’s EOD date labels. The week’s opening price on August 31st was $4,430.0, and the closing price on September 4th was $4,516.7998. The week’s high was $4,533.6001, and the low was $4,292.2002, with a range of $241.3999, reaching 5.4492% compared to the week’s opening price. The weekly closing price change was +1.9594%, and during the week there was a significant pullback, but the closing price returned to the high side.
Regarding levels, the closing price is at the 62.21 percentile over the past 1 year and the 87.28 percentile over the past 3 years. Rather than indicating short-term overheating, the price is maintaining a high level within a longer-term range. The 3-month return is +4.1721%, the 1-year return is +25.6522%, and the long-term uptrend has not broken. However, the 20-day annualized volatility is at the 51.15 percentile over the past 1 year and the 78.66 percentile over the past 3 years, so price fluctuations are somewhat noticeable. This is a market where pullbacks and profit-taking tend to alternate, rather than a straightforward buying opportunity.
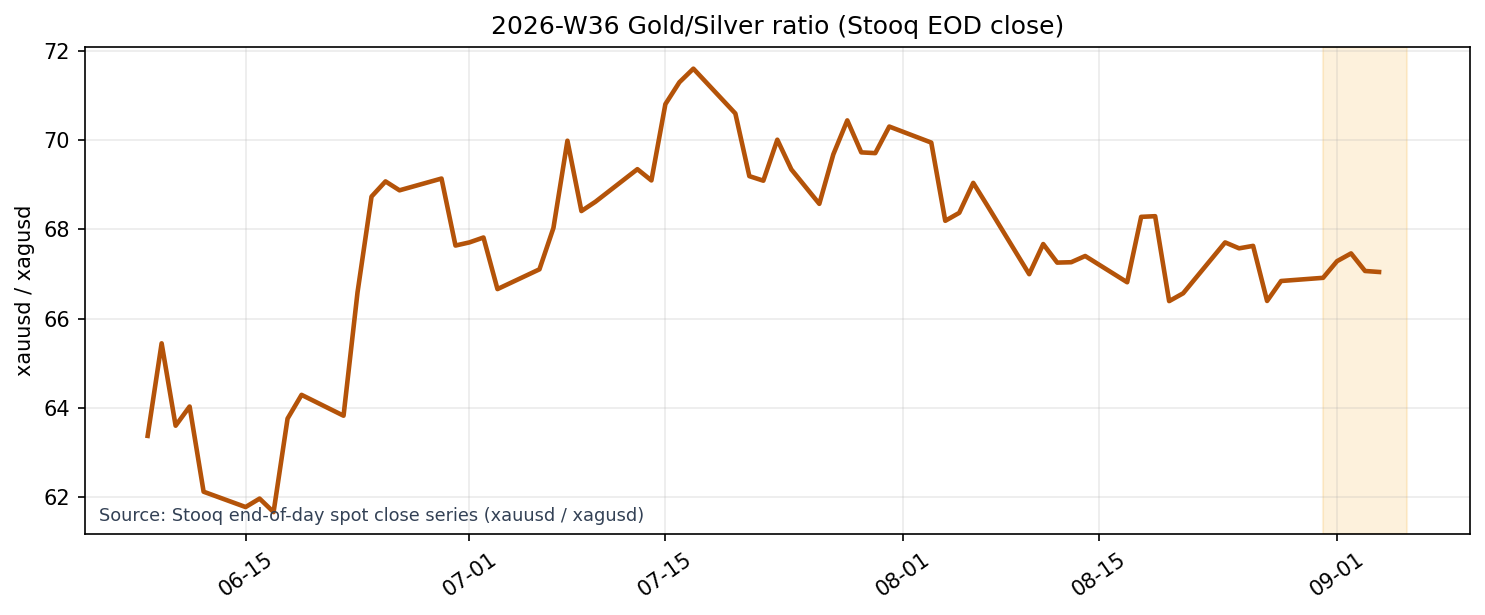
Source: Stooq end-of-day spot close series (xauusd / xagusd).
Relative prices show that the gold-silver ratio is 67.0447. This is up +0.3028% week-over-week, indicating a slight advantage for gold against silver. However, this represents the 18.51 percentile over the past 3 years, which is relatively low, and a long-term silver-dominant structure remains. The gold-WTI ratio is 47.5295, down -10.2394% week-over-week. WTI is at $91.48, reaching the 91.25 percentile over the past 3 years, which has eroded gold’s relative purchasing power.
③ Investor Activity
CFTC COT data as of August 25, 2026, showed money managers holding a long position of 159,819 contracts, a short position of 15,072 contracts, and a net long position of 144,747 contracts. This represents a weekly increase of +3,099 contracts, indicating speculators are continuing to increase their long positions rather than reducing them.
However, this COT is not indicative of a "light" position. The net position is at the 92.16 percentile over the past 1 year and the 65.16 percentile over the past 3 years. On a 1-year axis, it is quite high, and on a 3-year axis, it is high but not extreme. Therefore, while there is still a little room for new buying to support a resumption of the uptrend, short-term selling pressure in response to negative news cannot be ignored.
Another point to note is that gold has not become a substitute for tech stocks. The 60-day beta to QQQ is 0.5408, with a correlation of 0.2250. The 252-day beta is only 0.0474, with a correlation of 0.0438. While there are times in the short term when it moves in the same direction as risk assets, in the medium term it exhibits a value movement pattern that is fairly independent.
④ Macroeconomic Environment Check
Macroeconomic conditions clearly exhibit dual characteristics. Firstly, the dollar is a supporting factor. The DXY is at 118.7479, with a 3-month change of -1.0714% and a 1-year change of -1.1490%. The dollar index is at the 22.04 percentile over the past year and the 7.65 percentile over the past 3 years, indicating a low level. A weaker dollar is a straightforward tailwind for gold prices denominated in dollars.
On the other hand, the cost of holding gold is severe. The US 10-year nominal interest rate is 4.79%, the 100.00 percentile over the past 1 year, and 98.39 percentile over the past 3 years. The US 10-year breakeven is 2.35%, the 73.93 percentile over the past 3 years, and the US 10-year real interest rate proxy calculated from that is 2.45%. This corresponds to the 99.60 percentile over the past 1 year and the 99.06 percentile over the past 3 years. This is a considerably heavy level for gold under normal circumstances.
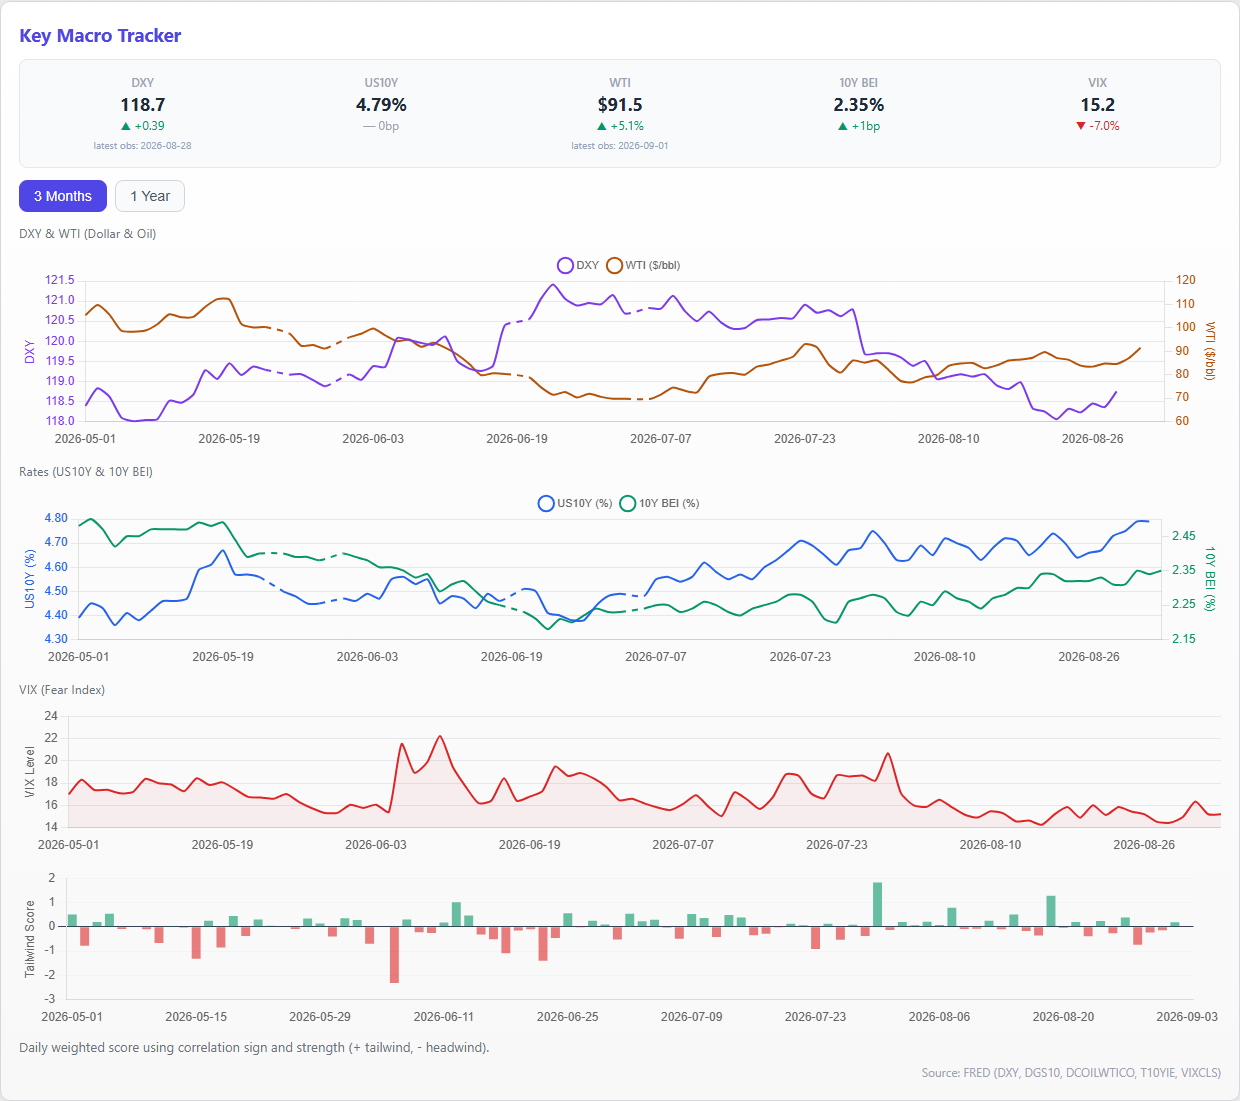
VIX is at 15.20, the 12.16 percentile over the past 1 year, and the 32.56 percentile over the past 3 years. It appears that the market is still calm rather than reflecting strong risk aversion buying. HY OAS is also at 2.66%, the 5.48 percentile over the past 3 years, indicating that credit concerns are not strong. The current high gold prices appear to be a combination of factors beyond crisis avoidance, including a weaker dollar, a preference for tangible assets, and continued buying by COT.
⑤ Supply and Demand and Sentiment
This week's gold-related articles numbered 19. The average raw score per article was 0.406947, which was positive, but the news sentiment after site correction was -0.095 on a weekly average, and the most recent value was also -0.06, indicating a slightly weak tone. In other words, the underlying content of the articles themselves is not necessarily negative, but the overall market perception is not yet uniformly bullish.
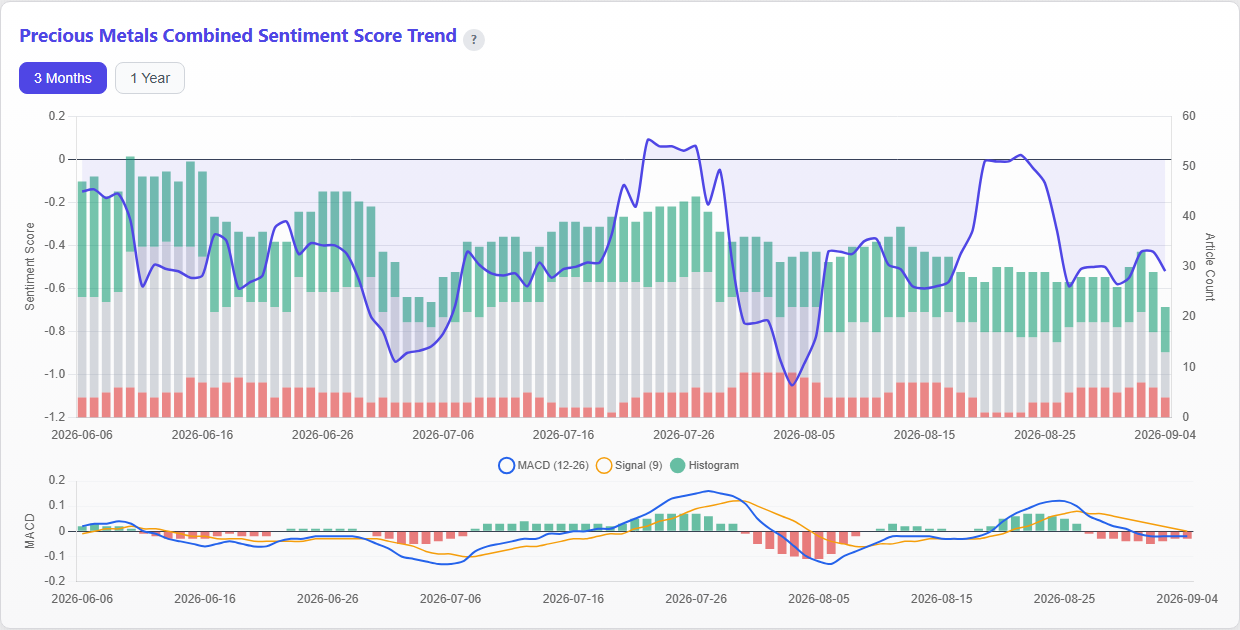
Daily figures showed a live score average of -0.3955 on August 31, 0.30175 on September 1, 1.15 on September 2, and 0.0 on September 3. The market recovered from weakness in the first half of the week, with strong positive factors concentrated on September 2. Article count was primarily 8 on September 1 and 6 on September 2, with gold search interest peaking mid-week.
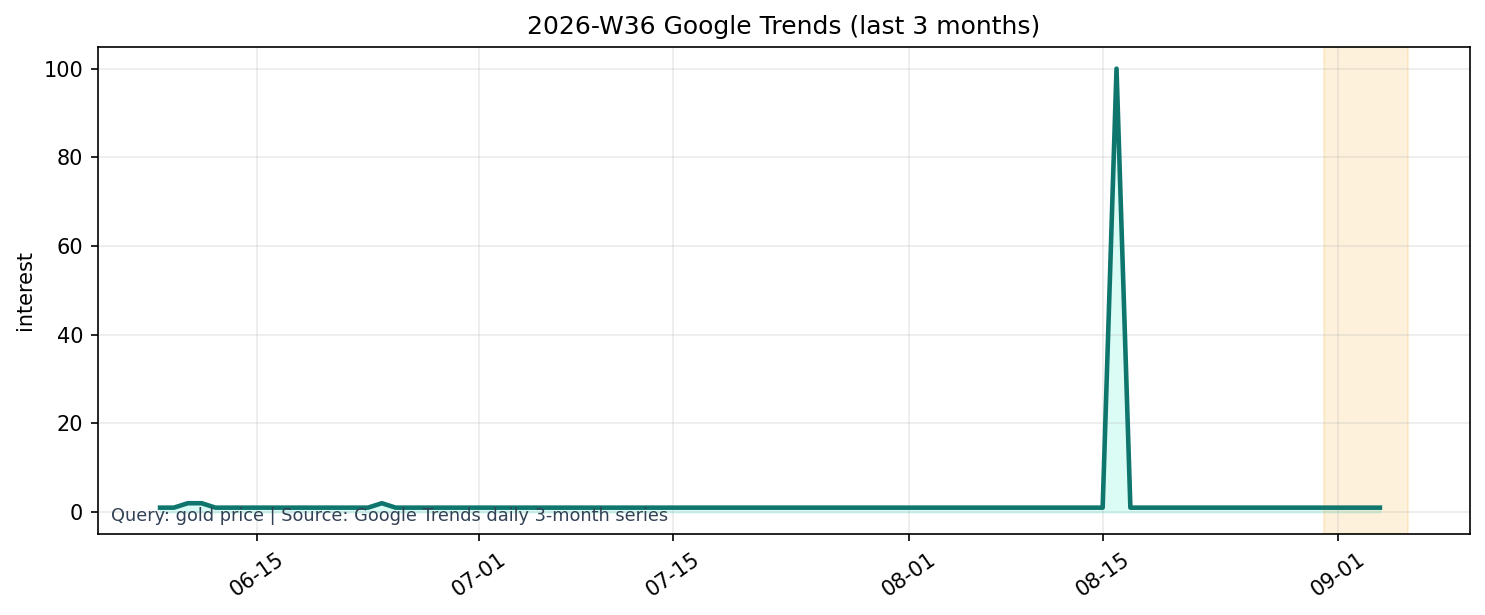
Source: Google Trends daily 3-month series (gold price).
Google Trends keyword: gold price. The latest value for a 3-month series is 1.0, unchanged from the previous day, and the 31.23 percentile over the past 3 years. For a 1-year series, the latest value is 29.0, a +7.4074% increase from the previous week's 27.0, but the 3-month change rate is -29.2683%, and the 1-year change rate is -32.5581%. Search interest is rebounding, but there is no sign of overheating. Despite prices being in a high price range, individual investors' interest has not yet caught up.
⑥ This Week’s Insights and Next Week’s Highlights
This week’s conclusion is that “gold is strong, but the basis for its strength is not monolithic.” Prices have risen on a weekly basis, and the closing price is also high over the past 3 years. The Commitment of Traders (COT) also increased net longs compared to the previous week. Based on this alone, a continuation of the bullish trend is likely. However, as a real interest rate proxy is at the 99.06 percentile over the past 3 years, the interest rate environment is, in fact, a headwind. Gold can test its upside while the dollar is weakening, but a reversal of dollar weakness will likely trigger profit-taking in the high-price range.
Next week, we will be watching four key factors. First, can we maintain the $4,500 level as a closing price? Second, will the DXY continue its downward trend, remaining at its three-year low? Third, will COT net longs continue to accumulate, or will they shift to profit-taking? Fourth, will Google Trends and news sentiment improve, lagging behind the price increase? If search interest and sentiment catch up, the uptrend will likely become demand-supply driven. Conversely, if prices lead and sentiment remains in negative territory, next week will likely be a week of testing the downside.