Gold continues to see buying interest even at high price levels. How to interpret the macroeconomic tailwinds and the underlying strength of supply and demand.
① One-sentence summary for this week:
Gold prices rebounded 1.12% on a weekly basis, and adjusted news sentiment improved to +0.48 by the end of the week. However, COT net longs decreased by 9,331 contracts. Prices recovered, but institutional investors remain cautious, making this week one to assess the sustainability of the rebound.
② Price Trends and Chart Review
This week's gold futures reference values rose from $4,169.4 on Monday, October 5th, to $4,216.3 on Friday, October 9th, resulting in a weekly gain of +1.1249%. The high for the week was $4,233.7, and the low was $4,091.2. The trading range was $142.5, or 3.4178% from the week's opening value. While recovering from the previous week's closing value of $4,162.3, it did not reach the $4,278.3 observed the previous week, indicating that the rebound from the sharp decline is still in progress.
Previously, we identified whether the price could maintain 4,143.1$ and recover to 4,278.3$, or whether real interest rates would decline from 2.92%, or whether the decline in COT data would stop, as key points. The result was that the price initially fell to 4,091.2$ before rebounding, but real interest rates remained almost unchanged at 2.91%, and COT data actually expanded the extent of the decline. While the price recovered, the conditions for a reversal that we set last week have not yet been met.
The closing price is up +5.2575% compared to three months ago, and +5.1269% compared to one year ago. Within the distribution of closing prices over the past three years, it is at the 76.99 percentile, maintaining around the top quarter on a longer time axis. The 20-day annualized volatility is 17.8855%. Over the past year, it is at the 12.21 percentile, while over the past three years it is at the 57.33 percentile, reflecting a significant difference in levels and indicating that the most recent year has been relatively stable.
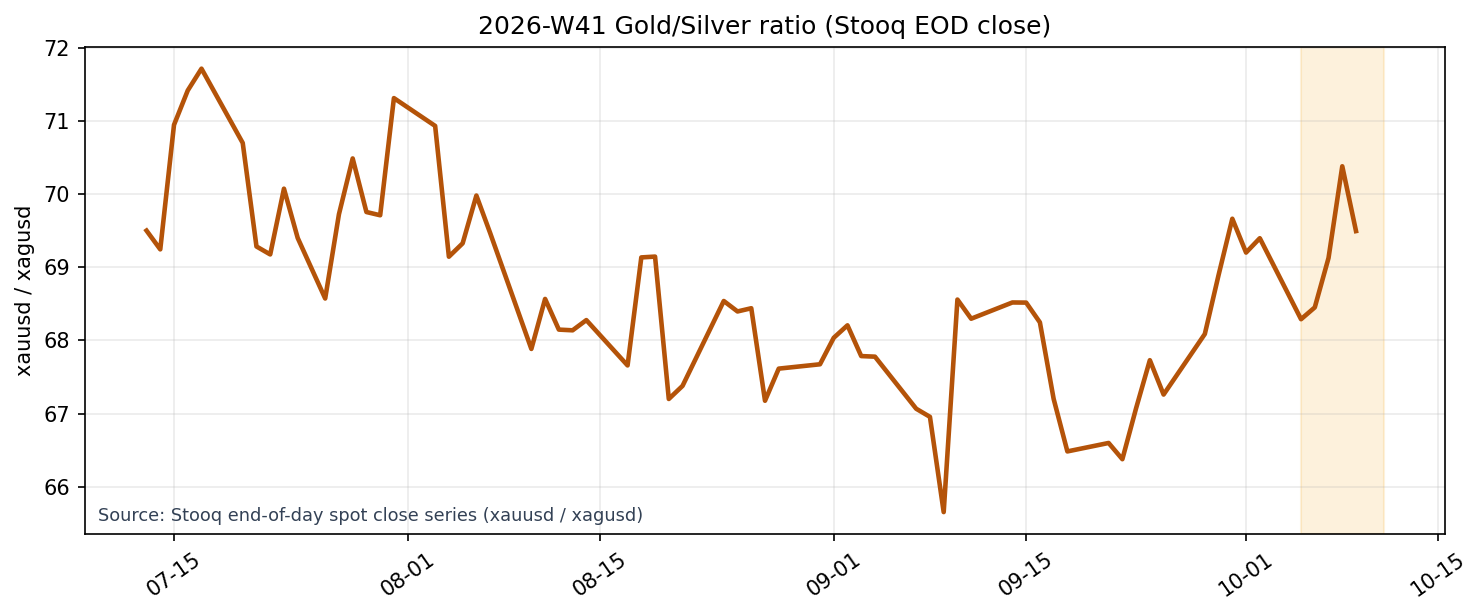
Source: Stooq end-of-day spot close series (xauusd / xagusd).
The spot prices in the chart above use Stooq’s end-of-day closing prices. The gold-silver ratio is 69.4956, a change of +0.1403% from the previous week, remaining almost unchanged. The gold-to-WTI ratio was also 42.7054, a change of +0.4355% from the previous week. This indicates that this week’s gold rebound was not a significant outperformance relative to silver and crude oil.
③ Investor Activity
CFTC COT (as of October 6) showed money managers holding 127,101 long contracts, 16,114 short contracts, and a net long position of 110,987 contracts. This represents a decrease of 9,331 contracts from the previous week’s 120,318, marking the fifth consecutive week of decline. The breakdown shows longs decreasing by 4,610 contracts and shorts increasing by 4,721 contracts. Continuing from the previous week, the liquidation of bullish positions and the accumulation of bearish positions advanced simultaneously.
Net positions are at the 50.00 percentile over the past 1 year, exactly at the median. Extreme overbuying has been resolved, but the price rebound and position direction are not aligned. Physical and short-term investors’ buybacks may have supported the price, but we cannot definitively determine the holder based on this data alone. Next time, it will be necessary to separately examine whether the decrease in net long positions will stop, or whether short increases will continue particularly.
④ Macro Factors Check
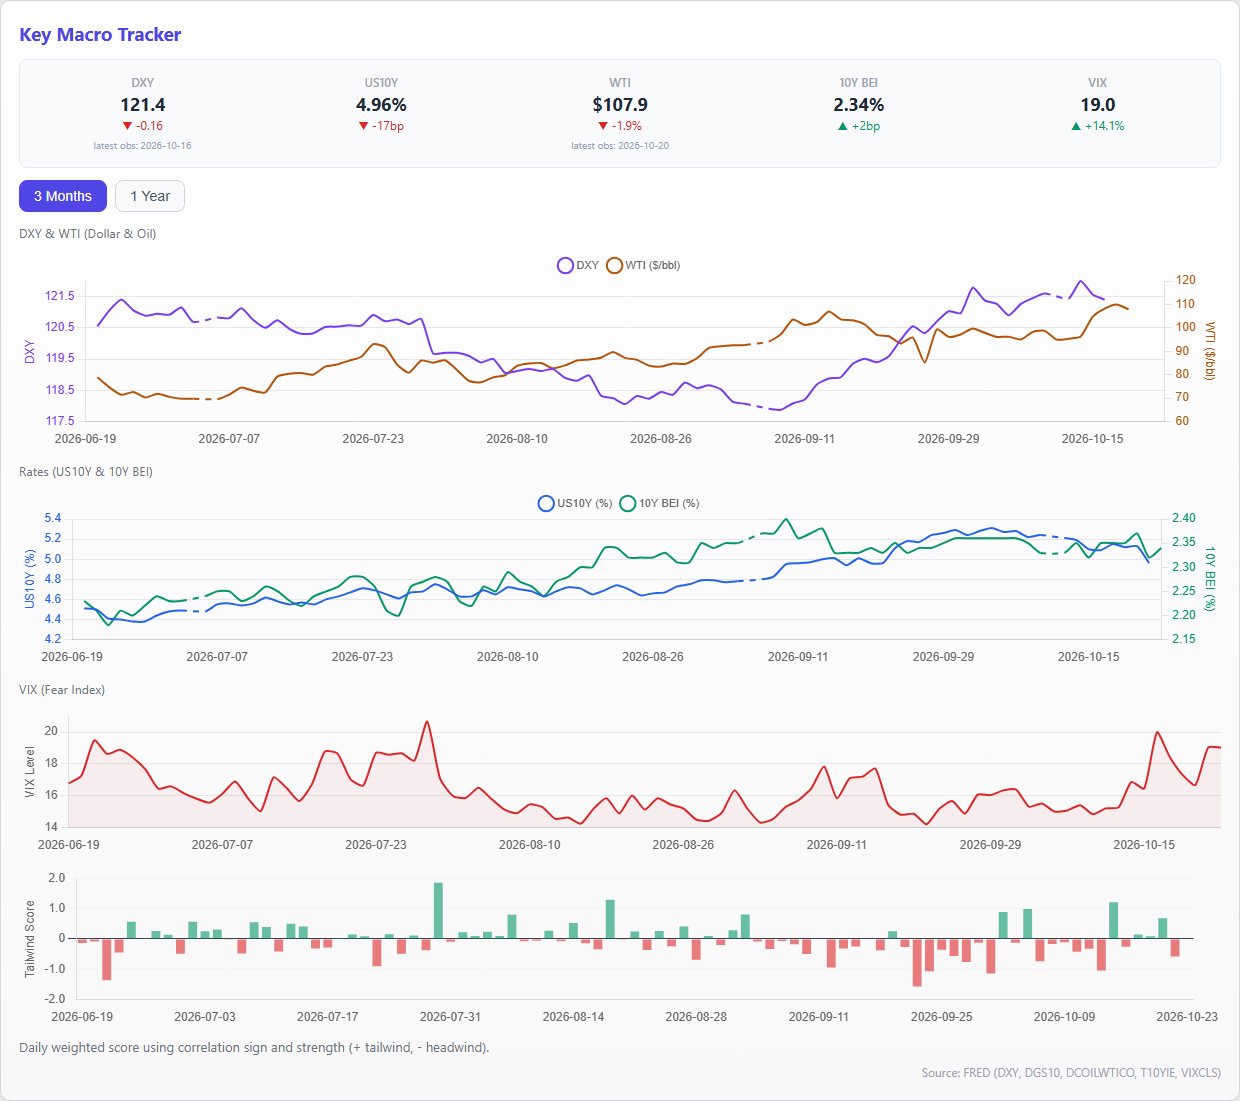
On October 9th, the US 10-year nominal interest rate was 5.24%, the breakeven inflation rate was 2.33%, and the real interest rate was 2.91%. This was almost unchanged from the previous week’s 2.92%, and the pressure on gold due to interest rates remains. The DXY also remained at a high level of 121.6023, and the fact that gold rebounded despite the lack of a clear tailwind for the dollar and real interest rates is significant.
The VIX fell to 14.84, and immediate demand for safe-haven assets is not visible. WTI rose to $98.73, while inflation expectations fell slightly to 2.33%. This week’s rebound should be interpreted not as a result of comprehensive improvement in the macro environment, but rather as an autonomous price recovery from the declines seen in the previous week.
⑤ Supply and Demand and Sentiment
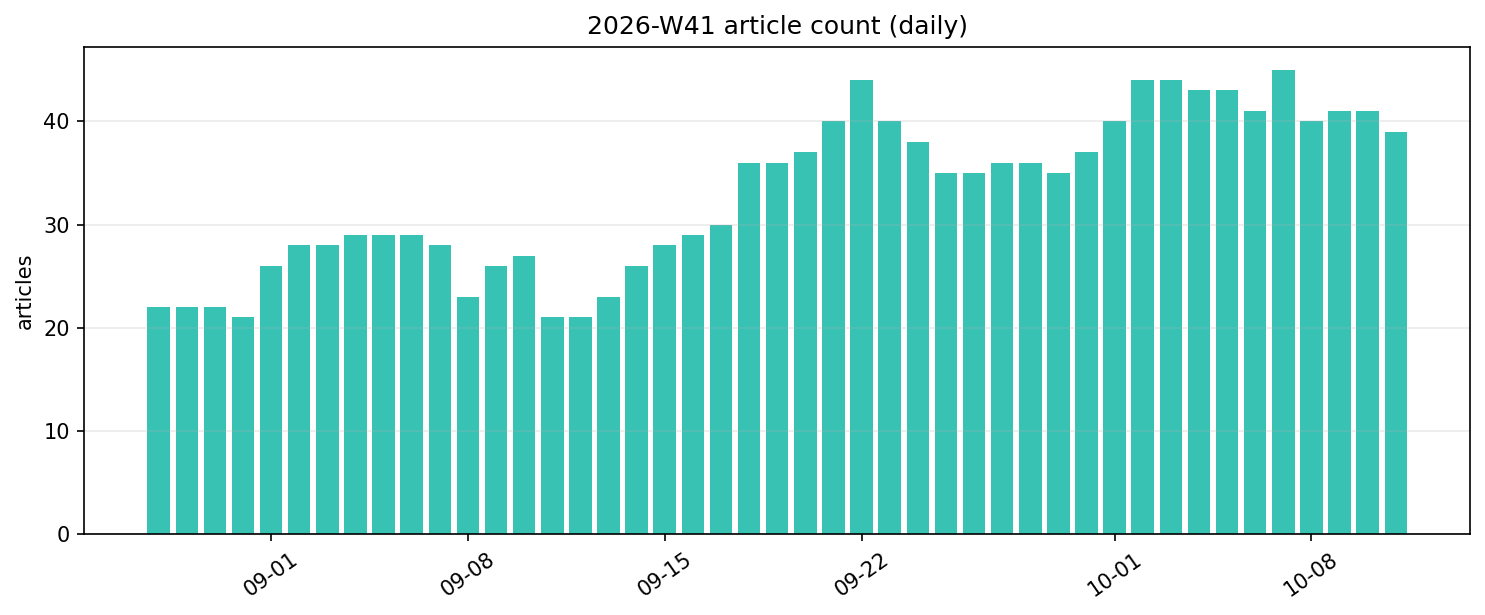
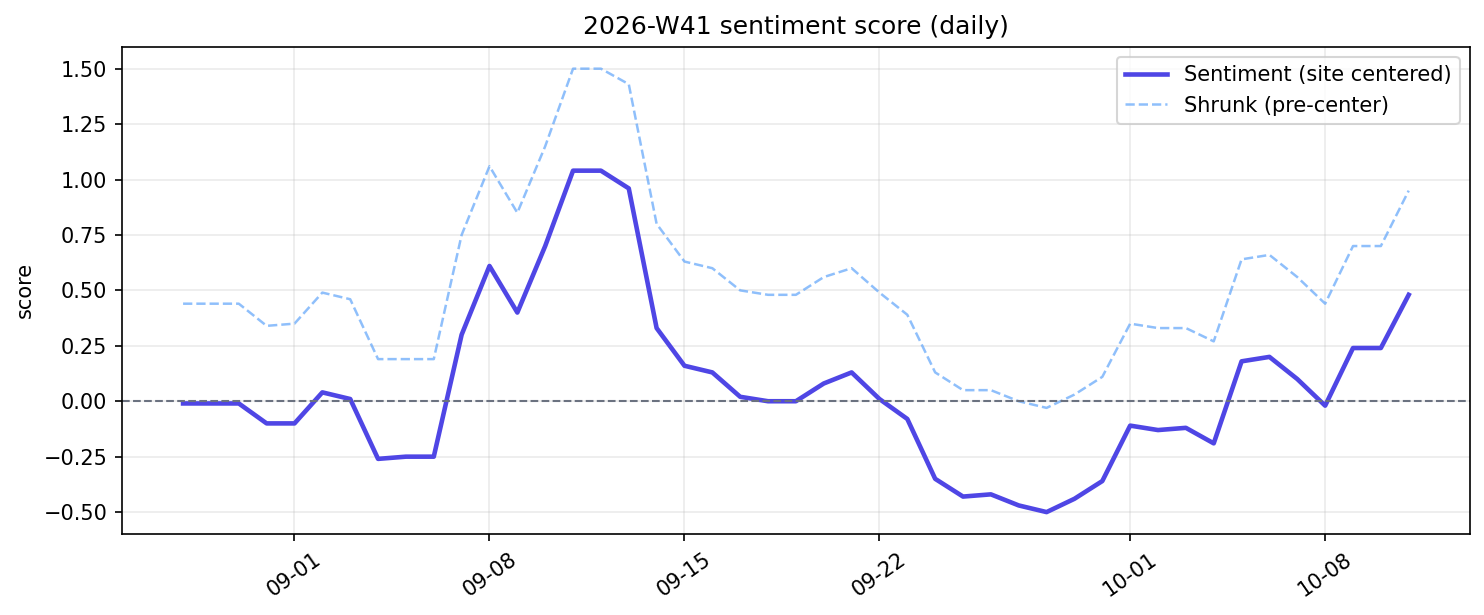
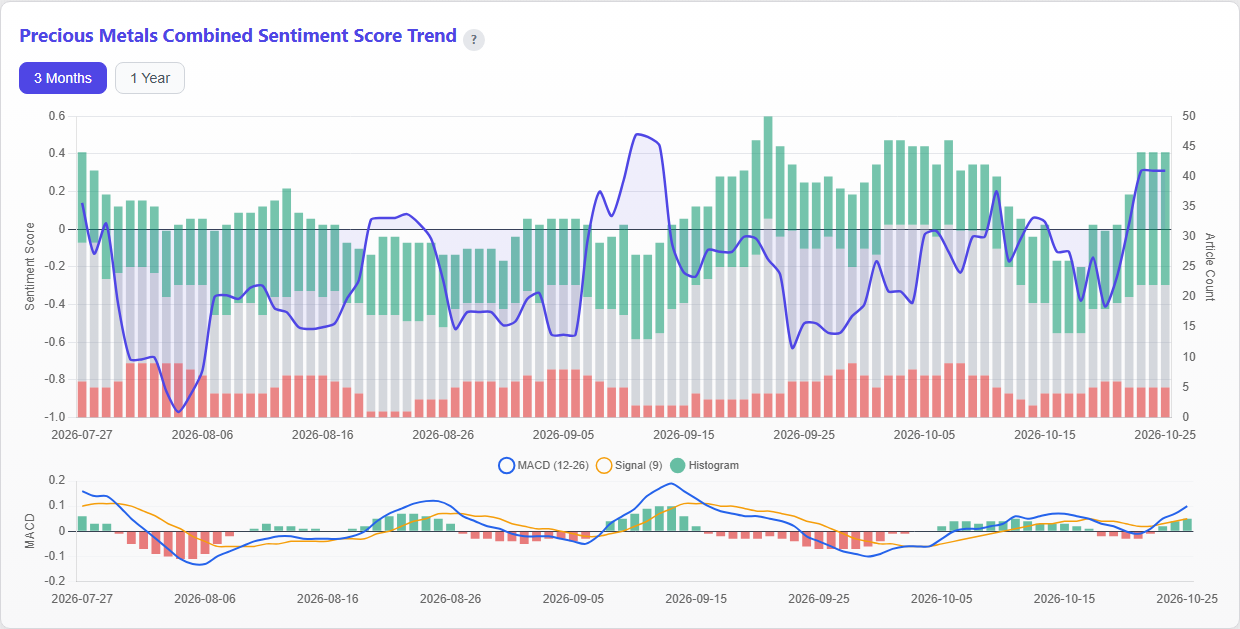
This week’s gold-related articles totaled 39. Site-adjusted news sentiment was +0.2029 on a weekly average, with the most recent value at +0.48. After temporarily falling to -0.02 on October 8th, it improved to +0.24 on the 9th and +0.48 on the 11th. The weekly average for the prior week was -0.2657, with the most recent value at -0.19, shifting from negative to positive territory and moving in the same direction as the price uptrend.
Source: Google Trends daily 3-month series (gold price).
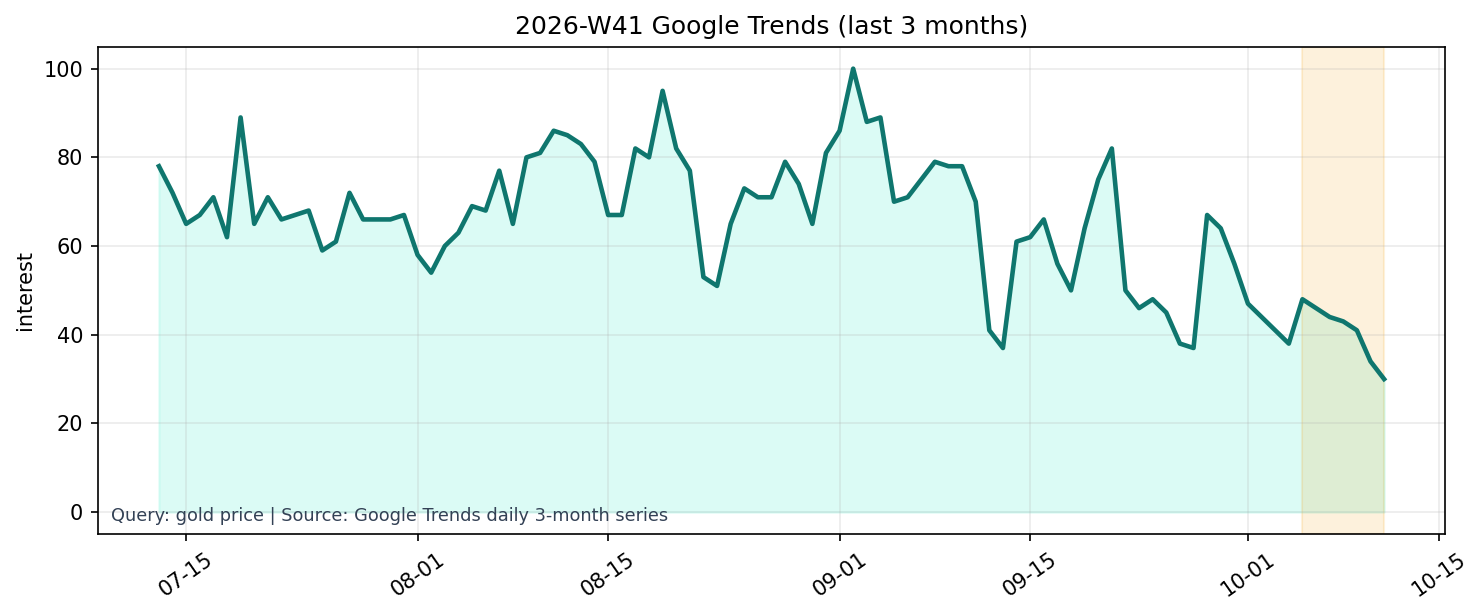
Meanwhile, general search interest remains weak. Google Trends data for "gold price" shows a 3-month series recent value of 30, down 11.7647% from the previous day, and a 1-year series value of 17, down 10.5263% from the previous week. The 1-year series value of 17 corresponds to the 1.89 percentile over the past year. While price and news sentiment have recovered, search behavior does not reflect a broadening of participation.
Source: Google Trends (gold price), daily 3-month and weekly 1-year series.
COT contraction, improved news sentiment, and declining search interest coexist, meaning that the overall sentiment cannot be described as definitively "bullish." While the tone of specialist news has become brighter, there is a temperature difference this week, with institutional positions and general interest still lagging behind.
⑥ This Week’s Insights and Next Week’s Highlights
The core focus this week is that gold prices rebounded by +1.1249%, and adjusted news sentiment improved to +0.48, while Commitment of Traders (COT) net longs decreased by 9,331 contracts. While prices and news indicate a recovery, institutional investors further reduced their positions. It wasn't a simple continuation of last week's weakness, but it’s also unclear whether the support for a reversal has broadened.
Looking back at last week’s observations, while failing to maintain the $4,143.1 level, the price rebounded from a low of $4,091.2 to $4,216.3. Real interest rates only slightly decreased from 2.92% to 2.91%, and the COT decrease continued. Therefore, this week’s rebound occurred without the support of falling interest rates and institutional buying; it was a rebound achieved despite their absence. This difference is crucial for gauging the sustainability of the trend next week.
Next week, we want to confirm three points. First, can the price recover to $4,278.3? If it fails to surpass this level and falls below $4,091.2, the view that this week’s rise was a short-term bounce will strengthen. Second, will real interest rates clearly decline from 2.91%? Third, will the rate of decrease in COT net longs narrow, and will short covering stop?
Another factor is the broadening of participation. If post-adjusted news sentiment remains positive and the 1-year series of search interest (検索関心) rises from 17, it is easy to judge that interest supporting the rebound has broadened. Conversely, if only prices rise and both COT data and search interest continue to decline, the recovery is not as substantial as it appears. We want to determine how many of the factors – price, interest rates, holdings, and search interest – align in the same direction.