Gold's Uptrend Has Paused but Remains Intact: Weekly Scenarios for Assessing the Nature of the Correction
① One-Sentence Summary of the Week
Gold fell 3.68% for the week, but COT positioning was low relative to the past 3 years, and news sentiment improved toward the end of the week. Rather than speculative enthusiasm collapsing, buyers' conviction is being tested amid high real interest rates.
② Price Action and Chart Review
This week's gold price opened at $4185.00 and closed at $4030.90 in the weekly OHLC snapshot (yfinance_futures), for a weekly change of -3.68%. The intraweek high was $4211.20 and the low was $4000.90. The weekly range relative to the opening price was 5.03%, indicating that intraday swings were larger than the decline itself. The closing price was at the 66.84th percentile over the past 3 years, still above the median on this longer measure, but it had fallen to the 5.73rd percentile over the past 1 year. This shows that after the price range over the past 1 year shifted higher than before, the price has recently been pushed back toward the lower end of that new range.
20-day annualized volatility was 18.93%. It was at the 19.08th percentile over the past 1 year, but at the 61.44th percentile over the past 3 years, presenting a different picture. Because volatility was high during the most recent 1 year, this week's price action was "quiet by recent standards, but somewhat volatile over a 3-year horizon." Rather than concluding that the market is in a panic based on the -3.68% figure alone, the key is whether selling accelerates around $4000 or is absorbed there.
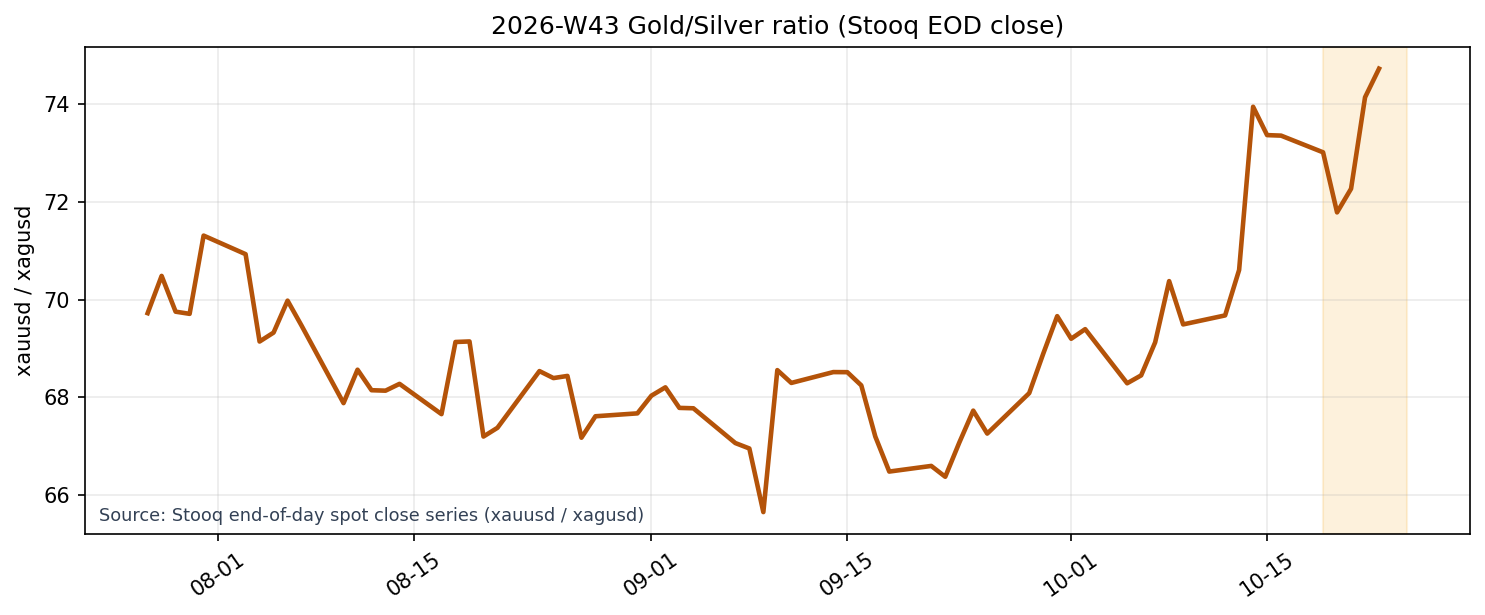
Source: Stooq end-of-day spot close series (xauusd / xagusd).
The gold/silver ratio chart, used as a reference for relative spot prices, is based on Stooq's end-of-day closing series for gold and silver. The gold/silver ratio was 74.73, up +1.87% from the previous weekend. Gold also declined, but held up relatively well against silver, indicating that a defensive preference for gold remained. Meanwhile, the gold/WTI ratio was 38.40, down -0.63% from the previous weekend. Gold's advantage over crude oil receded slightly, so rather than reading this decline as a wholesale move away from safe-haven assets, it is more natural to view it as a correction combining selectivity within precious metals with caution about the high-interest-rate environment.
③ Institutional Investor Activity
In the latest CFTC COT observation (October 13), money managers held 124,747 long contracts, 17,658 short contracts, and a net long position of 107,089 contracts. The net long position decreased by 3,898 contracts from the previous week, showing that institutional investors had been gradually reducing risk even before prices weakened. Total open interest was 396,345 contracts, and the contraction in net longs should be viewed less as an "abandonment of the bullish view" than as a sign that momentum to chase prices higher had weakened.
The level was at the 26.45th percentile over the past 3 years. The price decline does not mean that excessively accumulated speculative longs suddenly collapsed. Rather, positioning was relatively light, limiting the scope for forced selling during a decline, while also leaving little fuel for a rise without a new buying catalyst. Whether net longs increase again in the next COT report or bearishness deepens through an increase in shorts will affect the credibility of the battle around $4000.
④ Macro Factors Check
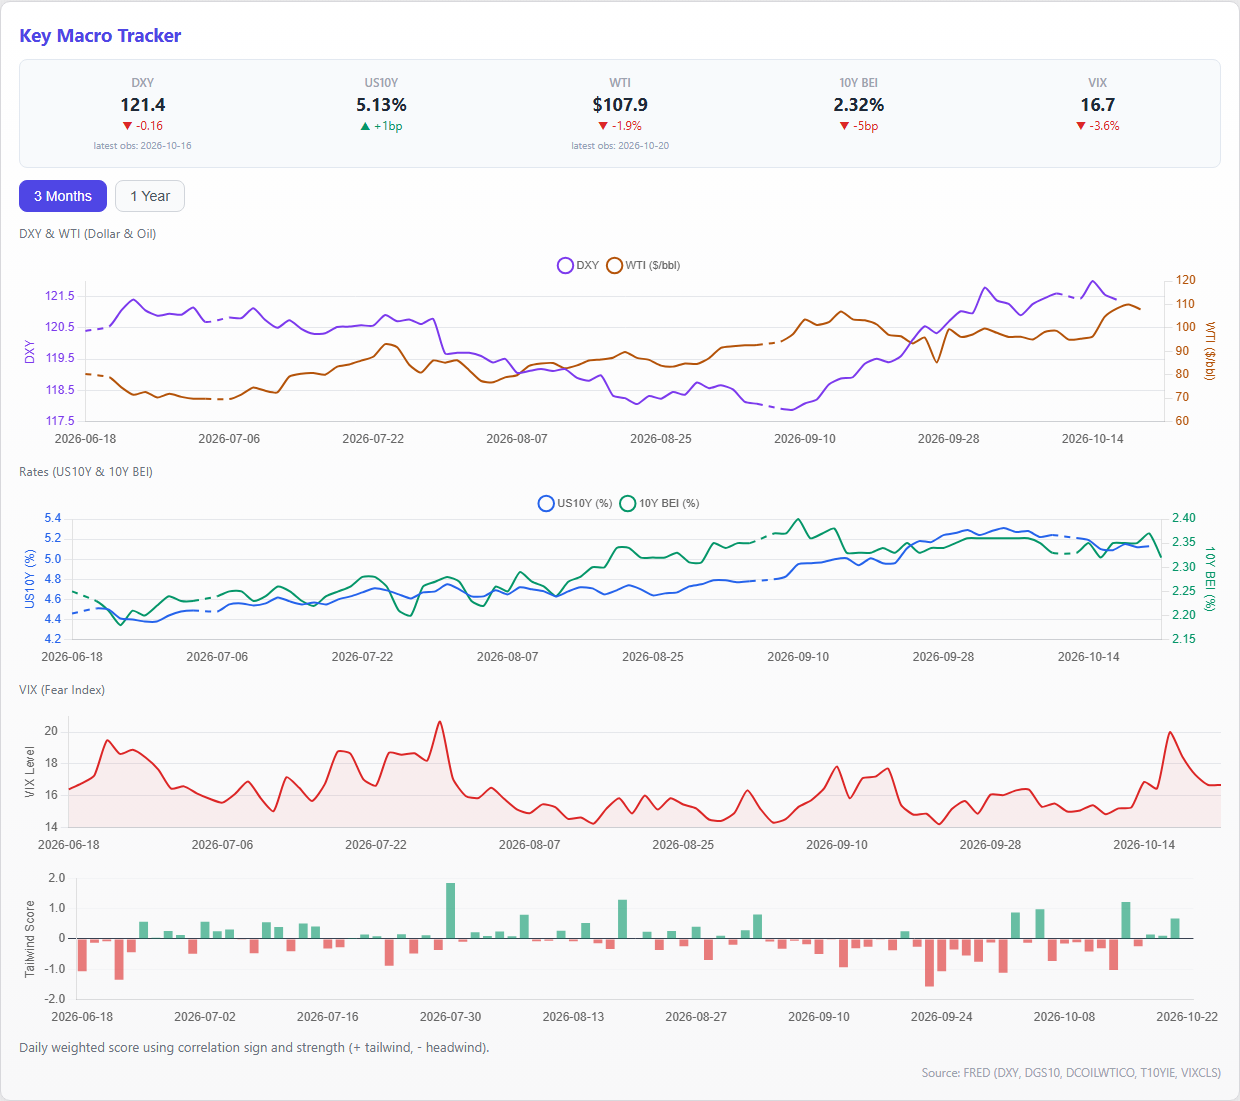
The macro backdrop is not an unequivocal tailwind for gold. The U.S. 10-year nominal yield was 5.13%, and the U.S. 10-year real-yield proxy was high at 2.76%, highlighting the cost of holding non-interest-bearing gold. DXY was 121.4048, up +0.52% over 3 months. With a stronger dollar and high real interest rates occurring together, gold needs support from supply and demand to rebound on its own.
However, in the latest observations, the real interest rate edged down from 2.77% to 2.76%, while DXY also slipped -0.14% from the previous day. The VIX was 16.68, not a level of tension high enough to strongly encourage risk-averse buying of gold. WTI was high at $107.89, while the breakeven inflation rate fell to 2.32%. Rather than expecting inflation-hedge buying based solely on high crude oil prices, priority should be given to confirming whether real interest rates continue to decline.
⑤ Supply, Demand, and Sentiment
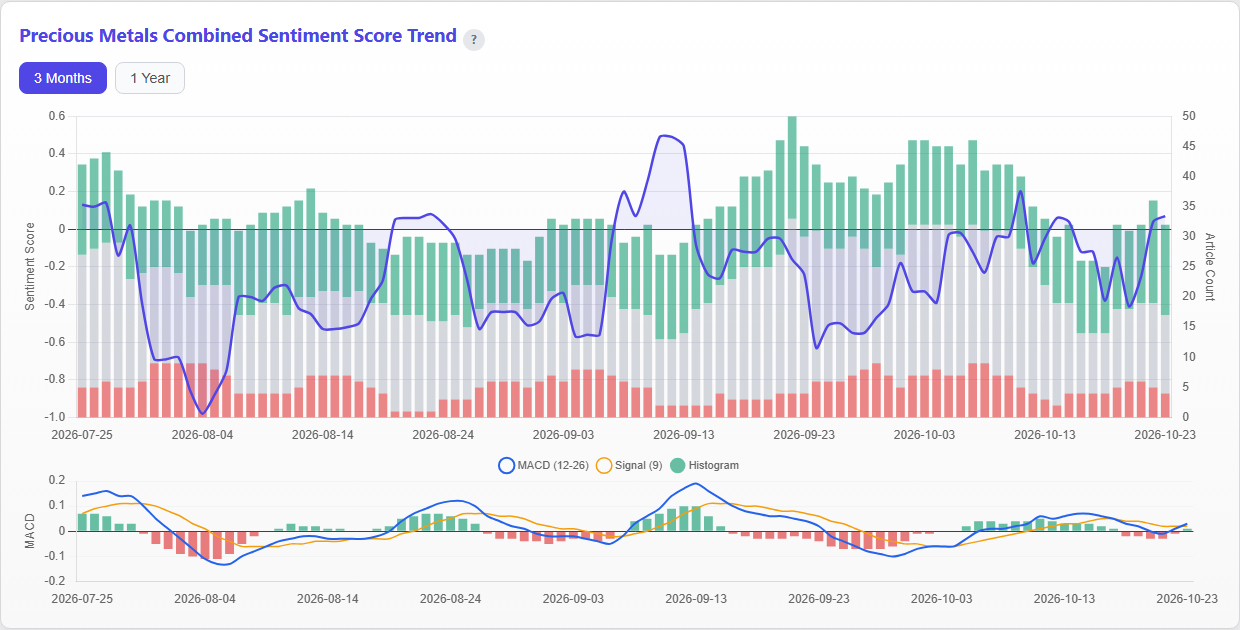
There were 31 gold-related articles this week. The primary indicator, site-adjusted sentiment, averaged +0.015 for the week and was nearly neutral. Its daily progression, however, improved from -0.12 on October 19 and -0.16 on October 20 to +0.02 on October 21 and +0.32 on October 22. The recovery in news sentiment during the latter half of the week despite the price decline was a small but supportive factor. The supplementary raw score averaged +0.9611 for the week, but because it is affected by differences among sites, this alone is not enough to conclude that sentiment has turned bullish.
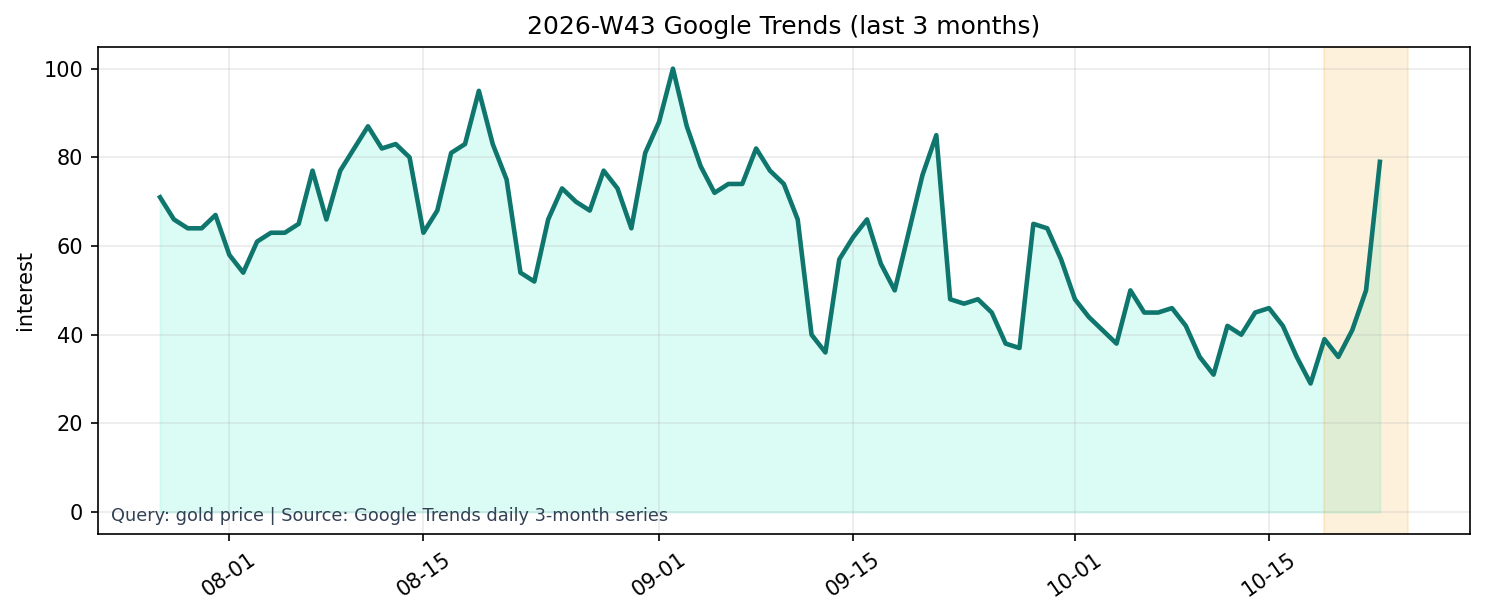
Source: Google Trends daily 3-month series (gold price).
The 3-month daily series for "gold price" on Google Trends rose sharply to 79, up +58.00% from the previous week. Meanwhile, the 1-year weekly series was unchanged from the previous week at 18. In the short term, the price decline drew searches, but public interest did not rise persistently on an annual scale. This difference shows that although temporary attention to the dip increased, it did not reach the level of enthusiasm. This is also consistent with COT net longs being low relative to the past 3 years, suggesting that supply, demand, and sentiment were closer to a wait-and-see stance than to overheating.
⑥ This Week's Insights and Points to Watch Next Week
The central point this week is that price, positioning, and sentiment were not moving in the same direction. The price fell 3.68%, and COT net longs also decreased by 3,898 contracts. Those facts alone would be bearish, but the level of speculative positioning itself was light, adjusted sentiment recovered to +0.32 by the end of the week, and short-term search interest increased. The current situation can therefore be characterized less as a phase of cascading liquidation than as a phase testing whether buyers who see a dip will actually commit capital.
Because the human-revised version from the immediately preceding week (2026-W42) was not saved, it is not possible to make a direct comparison by retrieving the observation points from the previous article. The hypothesis database also contains no past cycles, so this report is treated as the first observation in the accumulation loop. With that in mind, three combinations should be monitored next week.
The first is $4000 and real interest rates. If the closing price holds $4000 and real interest rates establish a downward trend from 2.76%, this week's decline could prove to be a test of the lower end of the range. Conversely, if the price breaks below $4000 and real interest rates rise again, defense should take priority over buying the dip. The second is price and COT positioning. If net longs increase from 107,089 contracts during a rebound, it would indicate renewed participation by institutional investors; if only the price recovers while COT positioning continues to decline, the rise is unlikely to be sustainable. The third is the persistence of sentiment. If adjusted sentiment moves clearly positive even on a weekly-average basis and the 1-year Google Trends reading also turns higher from 18, it will be easier to conclude that the short-term increase in searches has developed into broader interest.
From an operational perspective, it is important not to declare a bottom based on a single indicator. If at least two of the following align—"holding $4000," "declining real interest rates," and "an increase in COT positioning"—confidence in the rebound scenario will rise. Conversely, if a break below $4000 coincides with rising real interest rates, the improvement in sentiment will remain merely a contrarian hope. The absence of enthusiasm is not synonymous with the absence of further downside, but it also means that room remains for the next rise.