Gold Holds a High-Range Bias Despite Two Weekly Losses: Lower Real Rates and Uncrowded COT Point to a Bullish Correction
① One-Sentence Summary This Week
Gold declined on a weekly basis, but price levels remain high, and institutional positioning is not overheated. While the short term may see an adjustment phase, the underlying factors of a weaker dollar and low real interest rates persist. We are now at a point where we must determine whether this represents a "buying opportunity within an uptrend" or a "deeper correction.
② Price Trends and Chart Review
This week's gold spot price, based on Stooq's closing values, decreased from 5130.46 on 2026-03-09 to 5019.83 on 2026-03-13, resulting in a weekly change of -2.1563%. The highest price during the week was 5238.45, the lowest was 5009.83, with a range of 228.62. The weekly range from the opening price was significant at 4.4561%. While the closing price was lower than the week's opening, it showed some reluctance to decline near 5000, suggesting a correction within the recent high price band rather than a clear downward trend.
Volatility remains elevated. The 20-day moving volatility (annualized) is 27.8699%, placing it in the 90.43 percentile over the past three years. Conversely, the closing price levels are maintained at a high level, in the 97.15 percentile over the past three years and the 91.44 percentile over the past year. The 3-month return is 16.5921%, and the 1-year return is 68.1660%. Weekly declines are more easily interpreted as speed adjustments after an upward trend, rather than a trend reversal.
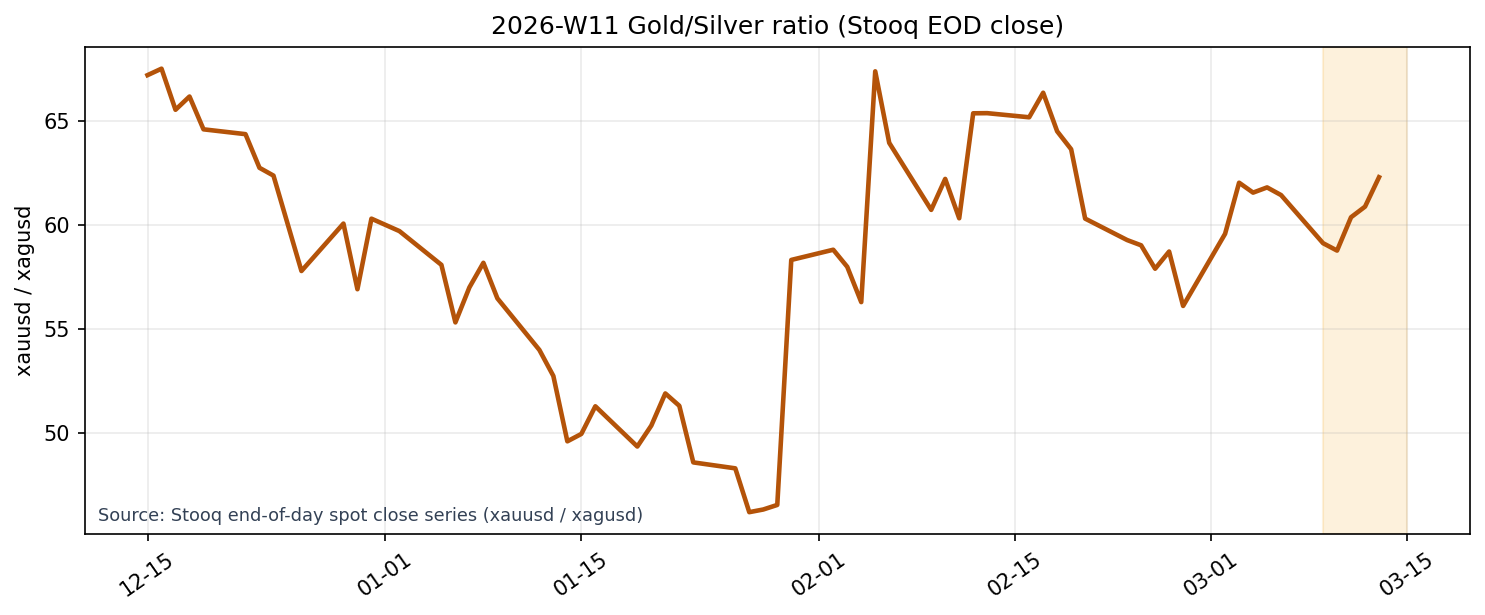
Source: Stooq end-of-day spot close series (xauusd / xagusd).
Let's also check relative prices. The gold-silver ratio is 62.2808, which is in the lower percentile range at the 6.08 percentile over the past three years, but has increased 1.3965% compared to the previous week, indicating that gold was slightly stronger than silver this week. The gold-oil ratio is 54.2416, down -4.4584% week-over-week. The ratio has decreased due to the sharp rise in WTI, but the level itself remains relatively high at the 82.46 percentile over the past three years.
③ Investor Activity of Institutional Investors
The latest CFTC COT report, as of March 10, 2026, showed that money managers' net long positions increased by 482 to 98,399. Long positions totaled 125,077, short positions 26,678, and open interest 413,956, indicating a slight increase in positions. Despite prices being in a high range, the level of net positions is relatively low, at the 15.38 percentile over the past year and the 28.21 percentile over the past three years.
The current market structure, where "speculation is not excessive despite high prices," also serves as a factor suppressing market fragility. Because the long position concentration isn't excessive, a chain reaction of sharp sell-offs is unlikely. However, additional buyers are needed for a clear resumption of the upward trend. Note that the 60-day beta to QQQ is 0.5408, with a correlation of 0.2250. The 252-day beta is 0.0474, and the correlation is 0.0438, indicating a considerably small degree of linkage with equities in the medium to long term.
④ Macro Factors Check
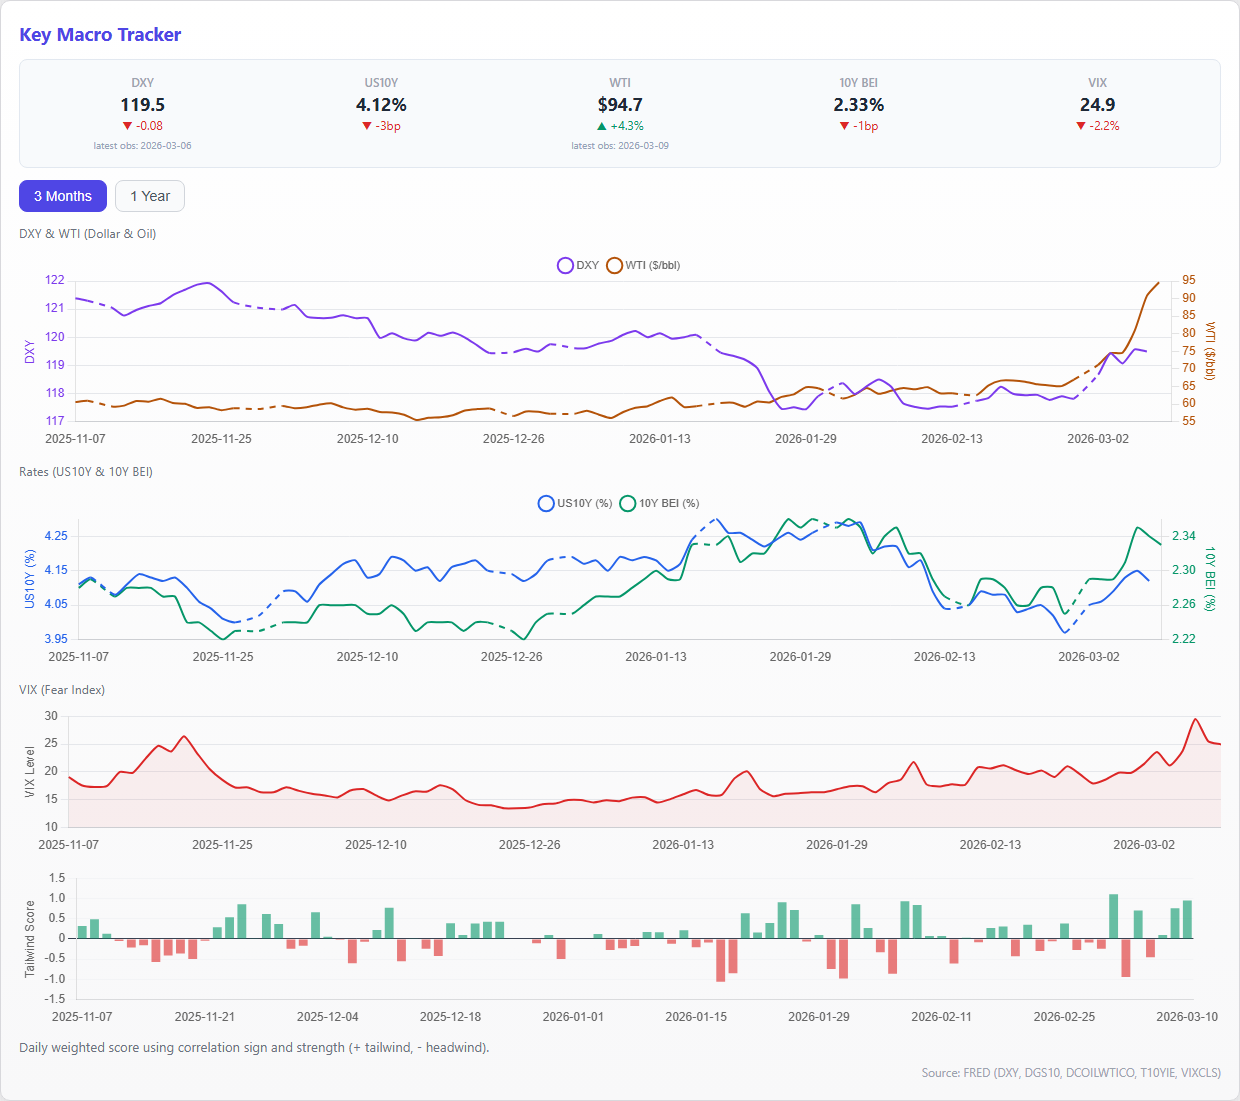
The macroeconomic environment remains largely unfavorable to gold. The DXY is at 119.491 (latest as of 2026-03-06), down -0.3877% over three months and -4.9352% over one year. The real interest rate proxy (U.S. 10-year nominal - 10-year BEI) is at 1.78% (as of 2026-03-09), continuing its downward trend, down -7.7720% over three months and -11.4428% over one year. U.S. 10-year nominal yields have also edged down to 4.12%, which continues to provide a supportive factor for gold regarding holding costs.
However, caution is warranted this week due to the combination of rising oil prices and a high volatility environment. WTI reached $94.65 (March 9, 2026), an extreme high level, up +66.1401% over three months and at the 100th percentile over the past three years. The VIX reached 24.93 (March 10, 2026), at the 96.49th percentile over the past three years, indicating strong investor anxiety. Typically, such conditions would lead capital to flow into gold as a safe haven asset, but this time, inflation concerns and profit-taking selling prevailed, suppressing price gains.
⑤ Supply and Demand and Sentiment
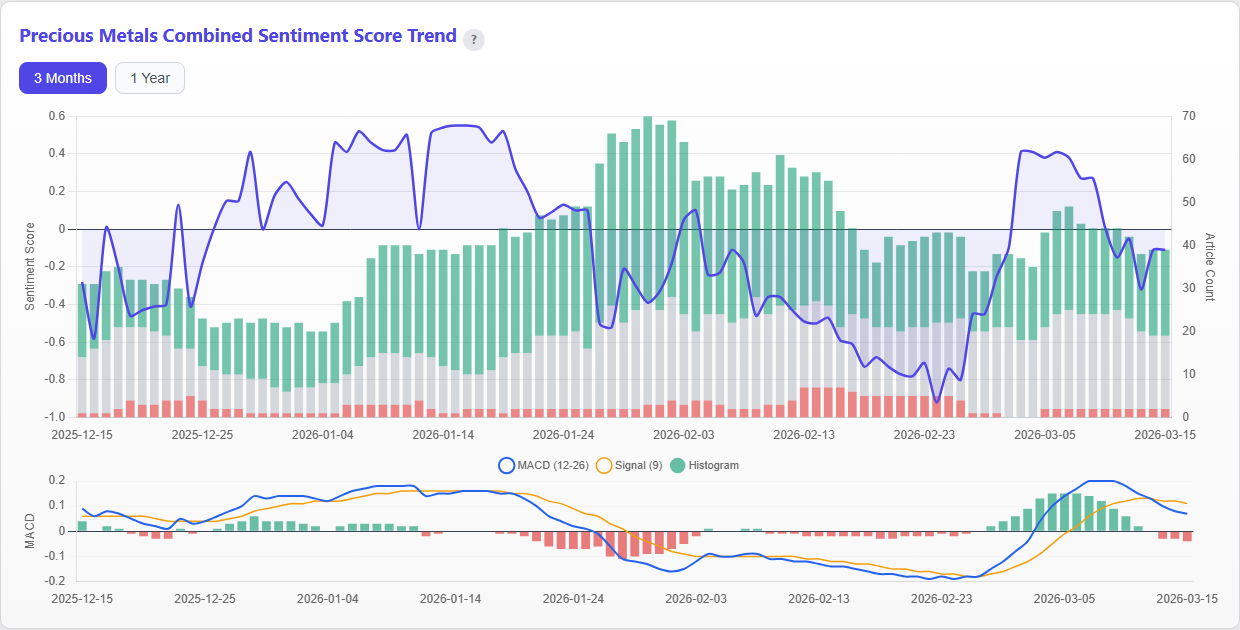
This week's gold-related articles numbered 35. Top tags included 企業 (corporate), 金融 (finance), 投資フロー (investment flows), 需給 (supply and demand), and 地政学 (geopolitics), with topics reflecting a mix of "risk-off" sentiment, "resource costs," and the "supply side." In terms of topics, continued mentions of the broad sell-off in U.S. stocks due to concerns about AI proliferation were observed, alongside views from Jefferies stating that "high oil prices are a burden on open-pit mines" and discussions regarding regional investment fund allocations.
Sentiment averaged slightly positive for the week, but slowed down towards the end. The adjusted sentiment average for the week was 0.0443, with the latest value at -0.02. On a daily basis, it decreased from 0.46 on March 9 to -0.25 on March 13, mirroring price declines and indicating a cooling in investor psychology. Raw score-based indicators remain in positive territory, but the overall trend shifted from a "strongly bullish" stance to one of "cautious observation" during the week.
Individual interest has also moderated somewhat. The latest value for the search term gold price is 18 over a 3-month period and 29 over a 1-year period. The 1-year period is down -17.1429% week-over-week, and the 3-year percentile is 44.64, indicating a mid-range level. Compared to the expansion of interest seen in previous weeks, this week appears to show an increase in "caution due to price peaks.
⑥ This Week’s Insights and Next Week’s Key Points
The key takeaway this week is that "price adjustments have progressed, but underlying structural factors remain intact." Prices fell -2.1563%, while medium-term support factors such as declining real interest rates, a weak dollar, and non-overheated Commitment of Traders (COT) data persist. The market has entered a reassessment phase, not necessarily weakened, but preparing for the next stage of an upward trend.
Looking back at last week's key points, firstly, the DXY and real interest rates functioned as expected to support gold prices. Secondly, the question of whether "high VIX will reconnect gold buyers" was not met; despite the sustained high level of the VIX, prices declined. Thirdly, search demand and news sentiment clearly weakened compared to the previous week. In other words, while macro support remains, the week's reality was a pause in the momentum from flows.
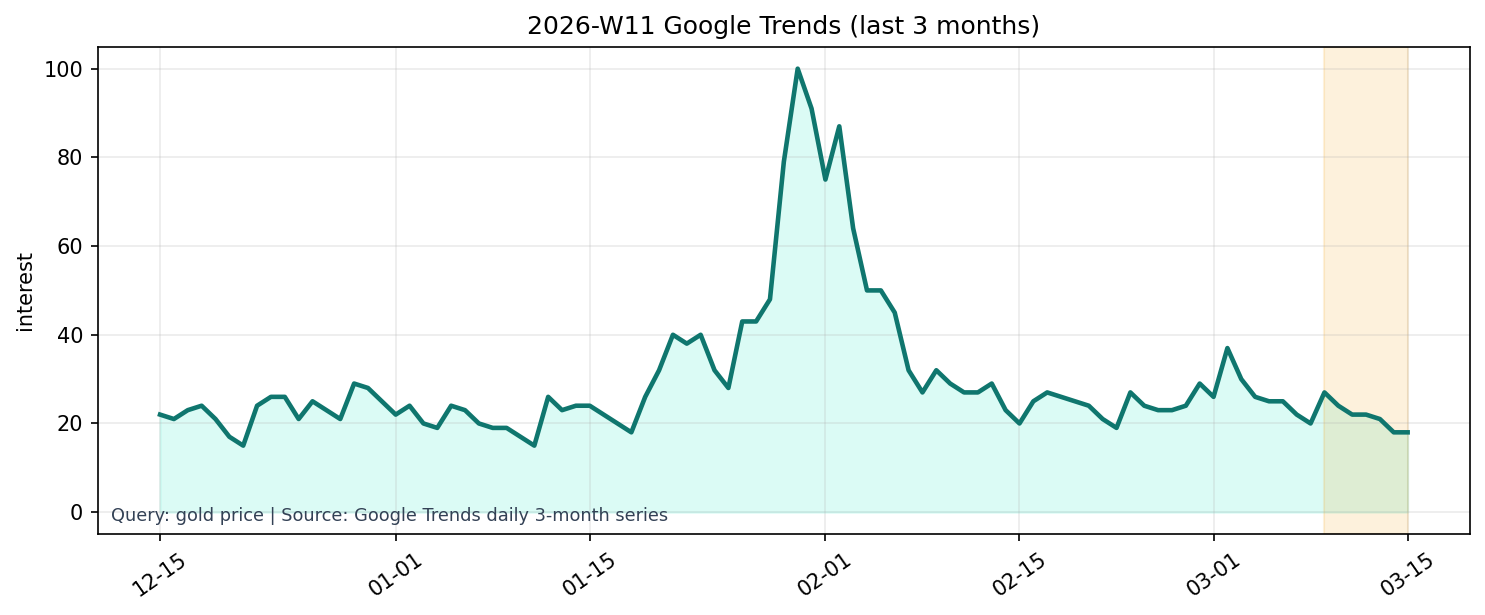
Source: Google Trends daily 3-month series (gold price).
Here are the key observations for next week. First, will the real interest rate of 1.78% and a low DXY level be maintained? If these do not break down, the 5000 level will likely be seen as a buying opportunity on dips. Second, will the Commitment of Traders (COT) net long position of 98399 shift to an upward trend? Simultaneous price rebounds and position expansion would increase the probability of trend continuation. Third, will the rally in WTI crude oil continue? Further increases in oil prices could suppress gold prices through cost and inflation concerns. Fourth, we need to confirm a bottoming out of sentiment and search demand. If adjusted sentiment recovers above the positive zone and Google Trends reverses its direction, this week's decline is likely to be a short-term adjustment. Conversely, if the price clearly breaks below 5000 and sentiment becomes fixed in negative territory, we should be wary of a deeper adjustment.