Gold prices remain strong, with buying continuing even at elevated levels. The question is how to interpret the favorable macroeconomic factors and underlying strength in supply and demand.
① One-Sentence Summary This Week
Gold rose +2.57% for the week, reaching 4,775.70, while CFTC speculative positions remained at the 23.23 percentile within a three-year distribution, indicating a relatively light week of market participation despite the price strength.
② Price Trends and Chart Review
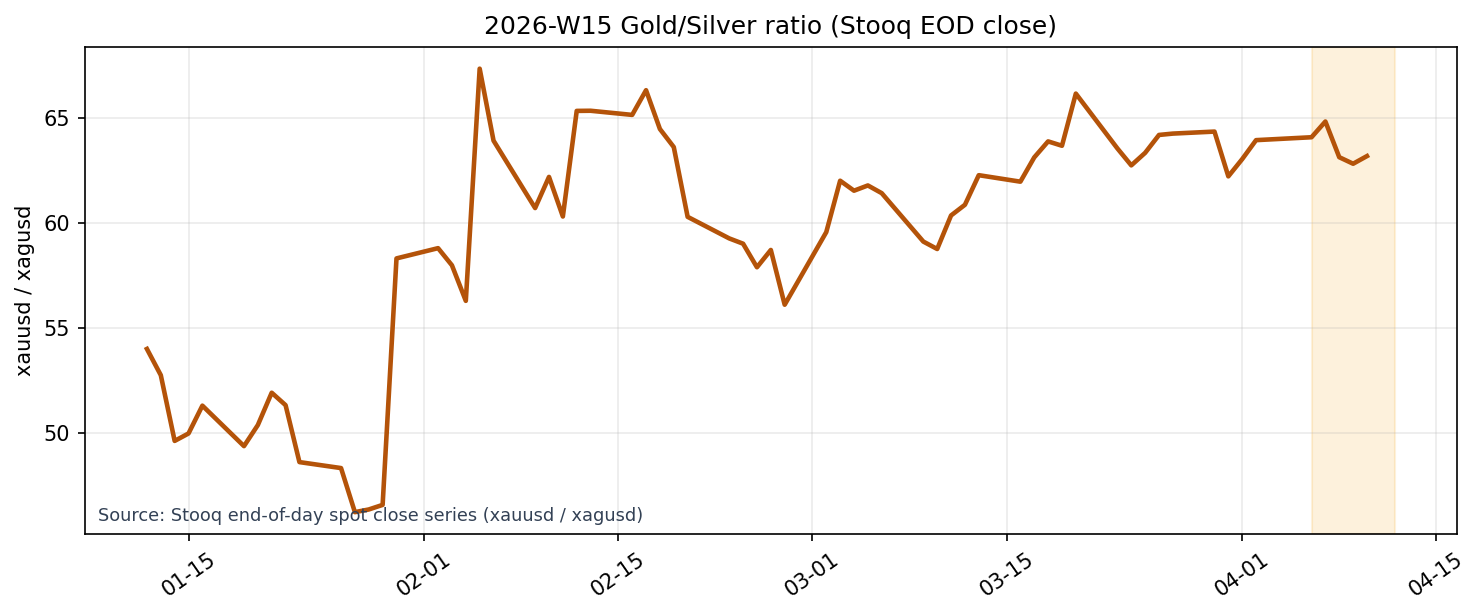
*Source: Stooq end-of-day spot close series (xauusd / xagusd).
This week’s gold price snapshot showed an increase from ¥4,656.10 on April 6 to ¥4,775.70 on April 10, a weekly change of +2.57%. The weekly high was ¥4,851.00, the weekly low was ¥4,605.00, the weekly range was ¥246.00, and the change from the opening price was +5.28%. While the closing price showed a solid increase, volatility during the week was significant, with strong gains coexisting with high fluctuation. The 20-day annualized volatility was 34.16%, placing it at the 89.06 percentile over the past year, indicating a market characterized by both buying pressure and a tendency for wide price swings.
Looking at the levels over the past three years, the Friday closing price of 4,775.70 is at the 94.57th percentile. This means that the current gold price is not only "high" but also in a considerably elevated zone compared to the past three years. Nevertheless, the three-month return is +3.85%, and the one-year return is +47.81%, indicating that the upward momentum is not just a short-term bounce but an extension of a medium-term trend. While the main price series and auxiliary charts should be viewed separately, the gold/silver ratio (using the Stooq closing price series xauusd / xagusd) can be used to confirm relative prices.
A key observation regarding price trends is that they are situated in a high price zone, but without exhibiting a one-sided frenzy. While the rate of increase has been substantial, the weekly trading range has been wide, and prices have been advancing to new highs while experiencing pullbacks. Rather than a clear breakout to new highs, it’s more accurate to characterize the week as one where the entire price range shifted upward, underpinned by strong demand and accompanied by volatility.
③ Investor Activity of Institutional Investors
The CFTC COT report's reference date is March 31st, with money managers holding a long position of 120,092, a short position of 27,278, and a net position of 92,814. The change from the previous week was a modest increase of +1,193, indicating that speculative activity has not strongly followed the upward price momentum. Considering a three-year comparison, the net position is at the 23.23 percentile. Given that the gold price itself is in a high zone, the COT remains near the lower quartile of the three-year distribution. This suggests that the recent price increase has not been solely driven by speculative overheating.
This pattern often appears when bullish factors and cautious participation coexist. If speculators were already heavily positioned, a reaction to the underlying factors would likely trigger a pullback, but that is not the case here. Rather, the price has already moved ahead, and positioning has not yet fully caught up. Continued accumulation by the Commitment of Traders (COT) in the coming weeks would further solidify the upward trend; conversely, if prices rise while the COT remains flat, it should be interpreted as a short-term exhaustion signal.
④ Macro Factors Check
Macroeconomic factors have not provided a one-way tailwind for gold. The DXY is at 120.6565, up +0.55% over three months. The US 10-year nominal interest rate is at 4.29%, up +2.39% over three months, and the real interest rate proxy is at 1.96%, up +3.16% over three months. Typically, a stronger dollar and rising real interest rates are a heavy combination for gold. Nevertheless, the fact that gold rose this week indicates that price formation was not simply reliant on dollar weakness.
Meanwhile, the VIX declined to 21.04, a -18.39% decrease from the previous day, and high-yield OAS also decreased to 2.94%, down -5.77% day-over-day, indicating it was not a week of extreme risk-off sentiment. WTI remained high at $114.01, and while inflation concerns persist, the situation is not as simple as gold being directly pushed upwards. In short, this week's macro environment was not an "ideal gold market," but rather a week where prices rose despite facing some headwinds. Therefore, this increase can be interpreted as having stronger underlying strength than it appears.
⑤ Supply and Demand and Sentiment
The number of related articles this week was 28, indicating that the news flow is not stagnant. The raw score of supporting indicators is positive at 0.770687, however, the primary indicator, site-adjusted sentiment, remains negative with a weekly average of -0.4775 and a latest value of -0.3. While news headlines may appear positive, market sentiment, after adjusting for media characteristics, remains cautious. The persistence of this sentiment even during a week of price increases suggests that the market is rising amidst skepticism rather than a surge driven by euphoria.
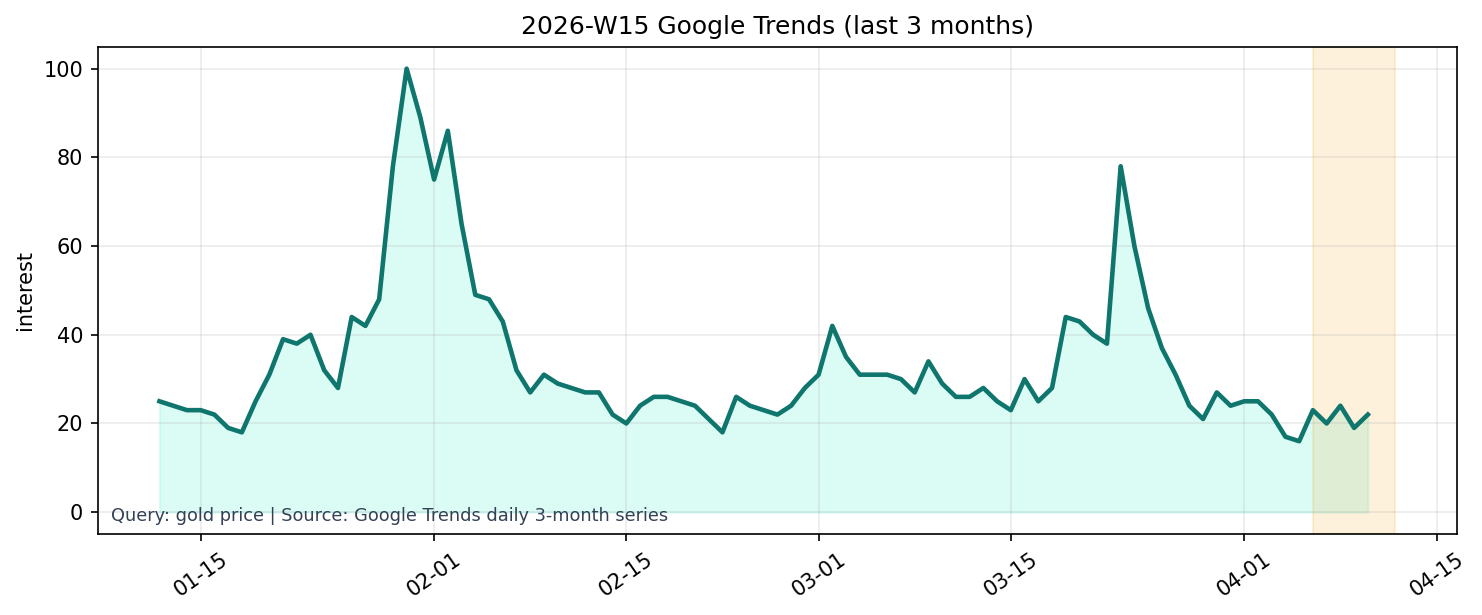
Source: Google Trends daily 3-month series (gold price).
Google Trends indicates a similar trend. The latest three-month series value for gold price was 22, a +15.79% increase from the previous observation, but a -12.00% change over three months. The one-year series was 32, down -20.00% week-over-week, and -5.88% over three months. Despite the week of price increases, general interest was relatively weak. Furthermore, the gold-silver ratio is 63.19, down -1.19% week-over-week, and at the 37th percentile over three years – a relatively low level. This suggests that the extreme outperformance of gold, relative to silver, is easing, indicating a slight moderation in the preference for safe-haven assets. Summarizing supply and sentiment, this week’s gold price increase was not driven by speculative fervor ("everyone jumping in"), but rather demonstrated price resilience amidst a cautious market atmosphere.
⑥ This Week’s Insights and Next Week’s Key Points
The key theme this week was the simultaneous presence of price increases and caution among market participants. The closing price reached 4,775.70, entering a high level at the 94.57 percentile over the past three years. However, COT net positions remained at the 23.23 percentile over three years, with adjusted sentiment averaging -0.4775 for the week, and Google Trends data over one year declining to 32. Strong, yet still not fully believed by everyone. This discrepancy is the defining characteristic of the gold market currently.
Here are four key points to watch next week. First, whether the real interest rate proxy will fall to 1.96%. A decline would further support this week’s gains. Second, whether the COT net position will increase further to 92,814. Continued price increases accompanied by speculative buying would strengthen the sustainability of the uptrend. Third, whether the latest corrected sentiment reading of -0.3 will return to positive territory. Improved sentiment would likely transform the current “rise amidst skepticism” into a more stable trend. Fourth, the stabilization of Google Trends over the past year at 32. A return of search interest would indicate that price movements are not solely leading indicators.
The current scenario suggests a bullish continuation if prices maintain their high levels while Commitment of Traders (COT) and sentiment improve in retrospect. Conversely, if prices remain high but internal indicators fail to catch up, the market may appear strong but the pace of gains could slow. This week was not a week of hitting a ceiling, but rather one that tested the quality of the strength. Therefore, the next thing to confirm is not simply “will prices rise?” but “who will begin to participate in that rise?”