Gold prices remain strong, with buying continuing even at elevated levels. The question is how to interpret the favorable macroeconomic factors and underlying strength in supply and demand.
① One-Sentence Summary This Week
Gold was up 3.00% for the week as of April 15, reaching a high of 4,844.90. Conversely, the CFTC Commitment of Traders report showed a decrease of 2,782 to 90,032, remaining at the 20.65 percentile over three years. Despite the strong price, speculative positioning remains light, and this week will be characterized by a steady rise supported by a weaker dollar, declining real interest rates, and inflation concerns, rather than an "overheated buying" scenario.
② Price Trends and Chart Review
*Source: Stooq end-of-day spot close series (xauusd / xagusd).
The primary price snapshot is sourced from yfinance_futures, showing an increase from ¥4,704.00 on April 13th to ¥4,844.90 on April 15th. The weekly gain is +3.00%, with a weekly high of ¥4,854.30, a weekly low of ¥4,704.00, and a weekly range of 150.30, representing a 3.20% increase from the opening price. Following last week's attempts to test the upper limit, a notable characteristic this week is that the high has not been broken despite accompanying volatility.
Regarding levels, the closing price is at the 85.49th percentile over one year and the 95.20th percentile over three years. The 20-day annualized volatility is 34.85%, which has risen to the 96.89th percentile over three years. This indicates that gold is not only at historically high levels but also experiencing a period of significant volatility. However, the 3-month return is +3.72%, and the 1-year return is +45.61%, which can be explained not just as a short-term bounce but as a continuation of a medium-term upward trend.
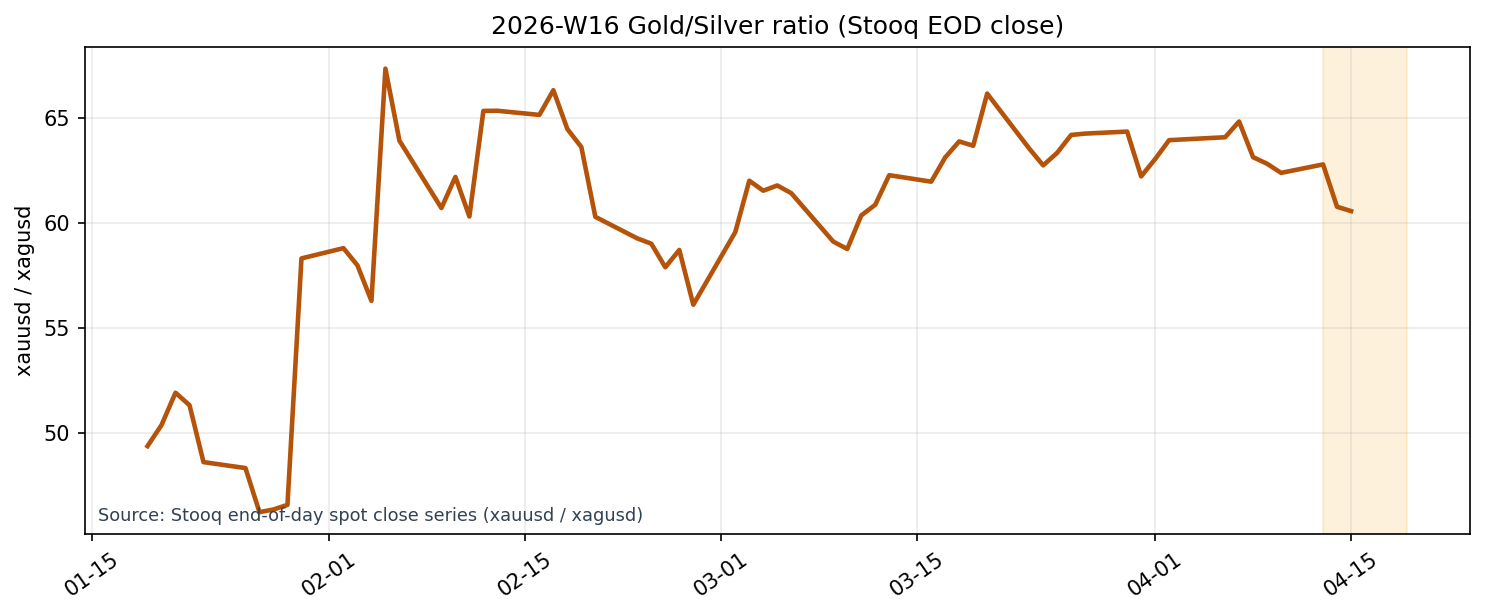
The gold-silver ratio in the supplementary chart is 60.57 based on the Stooq closing price series, a decrease of -2.92% week-over-week, and the 5.19 percentile over three years. Gold is rising, but not excessively bought relative to silver. Rather, the low gold-silver ratio suggests that funds are spreading across precious metals. It is natural to view this as continuing broad-based buying, not just gold-specific flight-to-safety demand, but including inflation resistance and physical asset demand.
③ Investor Activity of Institutional Investors
The CFTC COT report's reference date is April 7th, with money managers holding long positions at 120,726, short positions at 30,694, and a net position of 90,032. This represents a decrease of -2,782 compared to the previous week, indicating that speculators are taking a more cautious stance regarding price increases. Looking at a three-year comparison, the net position is at the 20.65 percentile. A one-year comparison shows a low of 1.96 percentile, meaning that, at least according to COT data, the market is not overbought.
This represents a significant shift from the previous week. Last week, the focus was on whether the Commitment of Traders (COT) report would catch up to the price increase; this week, it not only failed to catch up, but the net position has decreased. Price action has moved ahead independently, leaving speculative positioning light. This divergence raises questions about the sustainability of the uptrend in the short term. However, the fact that the price has maintained its high level even as position adjustments have occurred is a positive factor. If the COT report shows a renewed accumulation of positions in the coming weeks, it will further support the uptrend. Conversely, if the net position continues to decline, the price, even at a high level, will have a somewhat weaker base for further gains.
④ Macro Factors Check
The macroeconomic environment provided a favorable tailwind for gold this week. The DXY is at 118.8552, down 1.02% over 3 months and 3.36% over 1 year, and at the 7.53 percentile. The dollar is at a relatively low level, which is supportive for gold prices denominated in dollars. U.S. 10-year nominal interest rates are at 4.26%, down 0.93% day-over-day, while the real interest rate proxy is at 1.89%, down 1.56% day-over-day and 10.43% over 1 year. The decline in real interest rates explains the recent price increase, as it lowers the opportunity cost of holding gold.
Meanwhile, the breakeven inflation rate stands at 2.39%, placing it at the 91.90th percentile over one year and the 89.68th percentile over three years. WTI is also at $100.72, the 99.06th percentile over three years, which is extremely high. This indicates that inflation concerns remain. VIX has fallen to 18.36, and high-yield OAS has also decreased to 2.84, suggesting it is not a full-blown risk-off environment. This week’s gold price increase was not solely driven by “market anxiety” but was supported by simultaneous factors including a weaker dollar, declining real interest rates, and persistent inflationary pressures.
⑤ Supply and Demand and Sentiment
The number of related articles this week was 20, a decrease from 28 the previous week. While news volume has stabilized, the raw score of the auxiliary indicator is positive at 1.588313. The primary indicator, site-adjusted sentiment, averaged 0.105 for the week, with the latest value at 0.15, representing a modest improvement from the negative range of the prior week. News sentiment is finally beginning to catch up to price increases. However, the numbers still do not indicate strong optimism, and the improvement remains cautious rather than exuberant.
Source: Google Trends daily 3-month series (gold price).
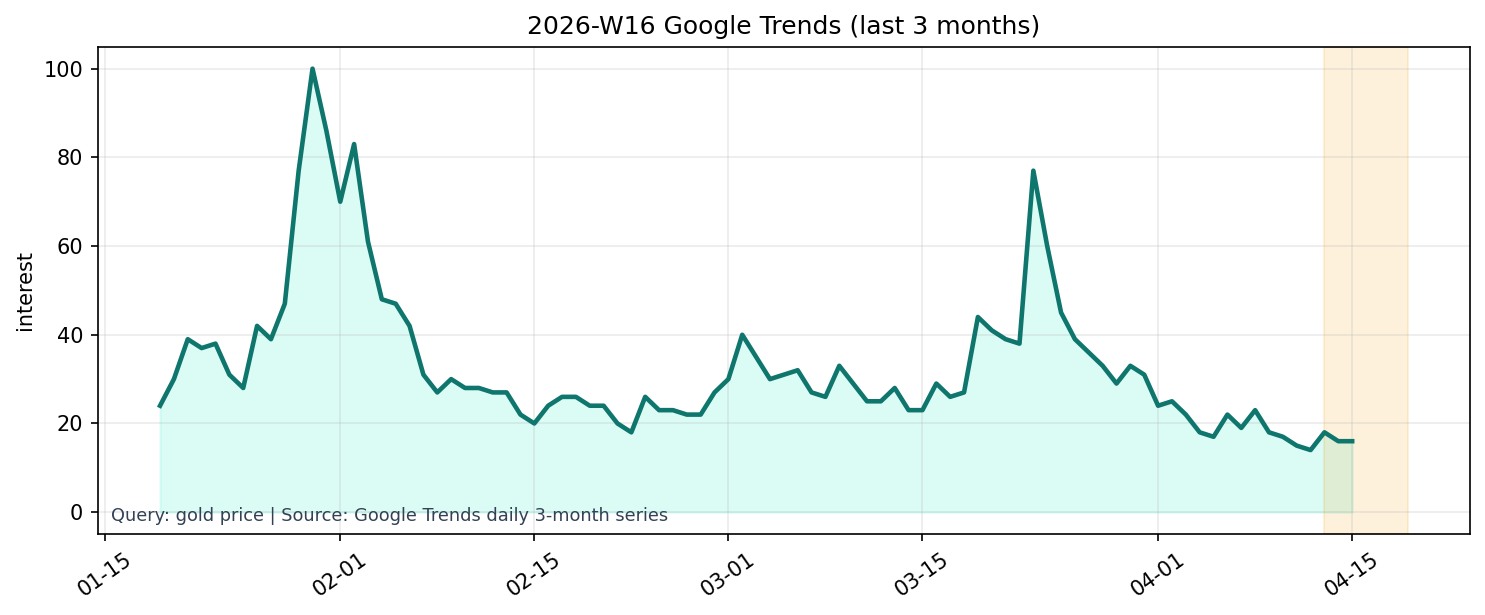
Google Trends is, in fact, cooling. The three-month series for gold price is 16, unchanged from the previous day, down 33.33% over three months, and at the 5.59 percentile over three years. The one-year series is also 28, down 9.68% from the previous week, and down 48.15% over three months. Despite prices being in a high range, search interest remains low. This indicates that the market is being driven upward not by enthusiasm from retail investors. Sentiment is improving, search interest is low, and the Commitment of Traders (COT) report shows light positioning. Combining these three points, we can conclude that the current rise in gold is occurring not because of popularity-driven demand, but rather amidst lingering skepticism.
⑥ This Week’s Insights and Next Week’s Key Points
This week's key point is that while real interest rates and sentiment, previously the focus of last week's report, improved, COT (Commitment of Traders) follow-through has been absent. The real interest rate proxy declined to 1.89%, and adjusted sentiment also returned to an average of 0.105 per week. These two factors support gold prices. However, the COT net position decreased to 90,032, falling to the 20.65 percentile over three years. In other words, macro conditions and investor psychology have improved, but institutional buying has not yet been confirmed.
Here are the four key points to watch next week. First, can the market maintain a level around ¥4,844.90? Sustaining this level would reinforce the perception of a consolidation within a high-price range. Second, will COT net longs (90,032) reverse and increase? Alignment between price and speculative positioning would enhance the reliability of an upward trend. Third, will the real interest rate proxy (1.89%) continue to decline? Further declines would provide a macroeconomic explanation for gold price increases. Fourth, will Google Trends (1-year series, 28) stop declining? A return of search interest would signal the beginning of participation from a broader audience.
The current base case scenario is that gold remains strong even at high levels, but speculative support is lacking. Prices are high and volatility is elevated, so short-term pullbacks are likely. Nevertheless, if dollar weakness and declining real interest rates persist, and the Commitment of Traders (COT) data again shows accumulation, pullbacks can be treated as adjustments within a continuing uptrend. Conversely, if the COT continues to decline and search interest remains low, even if the upward trend appears strong, the market will lack depth of participation. Next week will be a week to observe not only "whether prices will rise" but also "who will begin to participate in that rise.