Gold sees a brief rise, but the downtrend remains unbroken. This week's scenario focuses on assessing the quality of the correction.
① One-Week Summary
Gold fell from ¥4,707.60 on April 27 to ¥4,633.80 on April 30, a weekly decline of -1.57%. However, the COT net position increased to 95,141, up +5,109 from the previous week, remaining within the 3-year 25.97 percentile. While the price has paused, speculation remains relatively light, and this week will be about assessing the "quality of selling pressure" rather than a "breakdown of the uptrend.
② Price Trends and Chart Review
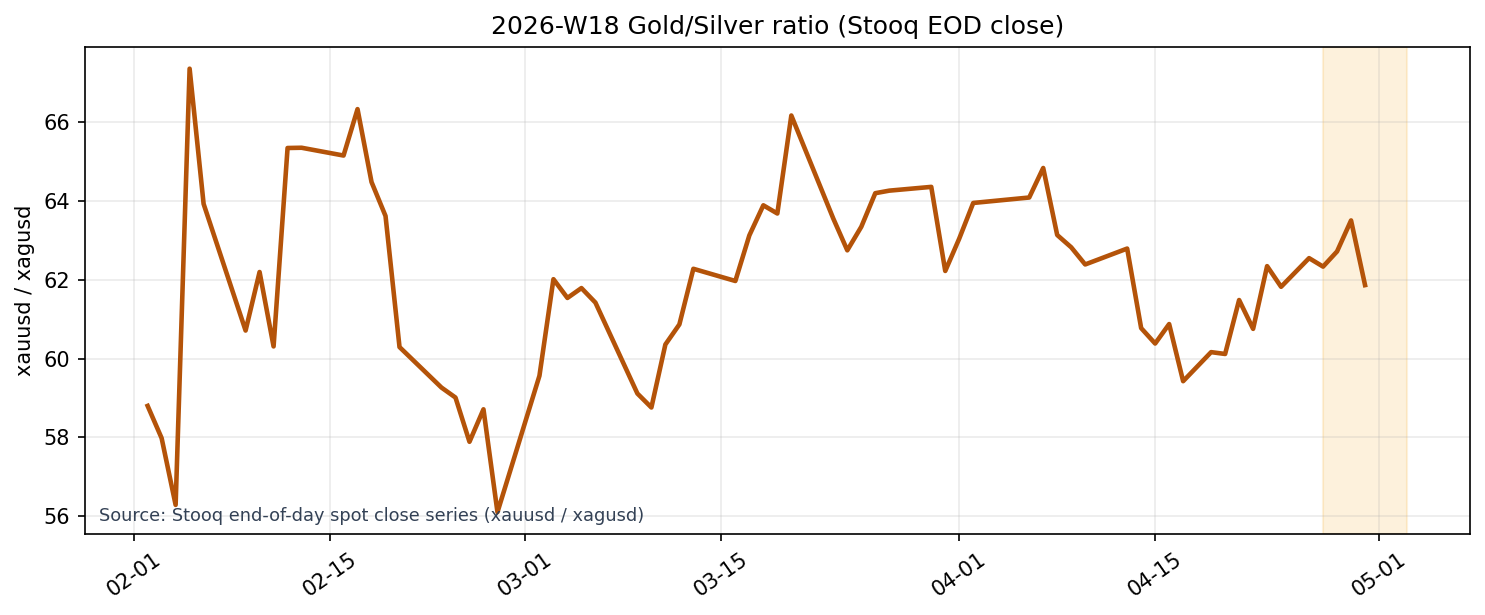
*Source: Stooq end-of-day spot close series (xauusd / xagusd).
The primary data series for price snapshots is yfinance_futures, while Stooq series end-of-day data is used for supplementary spot comparisons. Gold began the week at ¥4,707.60 and closed at ¥4,633.80. The weekly change was -1.57%, with a high of ¥4,711.10, a low of ¥4,515.70, and a weekly range of 195.40, representing a 4.15% increase from the opening price. The price paused after the previous week's gains, but the closing price has not collapsed in proportion to the decline.
The closing value is at the 91.60 percentile over the past three years, which remains at a relatively high level. 20-day annualized volatility is 19.30%, not excessively high at the 74.68 percentile over three years. This means that while price levels are high, current volatility is considerably calmer than the turbulent market conditions seen in March. The three-month return is -0.59%, indicating a sideways trading range, but the one-year return remains at +43.30%, suggesting that the medium-term trend has not yet broken down.
Relative pricing showed that the Stooq end-of-day series gold-silver ratio was 61.87, a decrease of -1.09% from the previous week. This is also a relatively low position, at the 6.98th percentile over three years. This indicates that silver was relatively stronger than gold within the precious metals this week. It is natural to interpret this as a situation where funds are not solely fleeing into gold, but rather remain within the precious metals sector as a whole, while the momentum of gold alone has temporarily softened.
③ Institutional Investor Activity
The CFTC COT reporting date is April 14. Money managers' long positions were 125,422, short positions were 30,281, the net position was 95,141, and open interest was 362,274. Compared to the previous week, the net position increased by +5,109. Despite a weekly price decline, speculators have modestly increased their positions. This is a key point for this week.
The level of sentiment remains at the 25.97th percentile over three years. It is not yet a crowded long position, and at least according to COT data, it is not a market "everyone has piled into." The fact that positions have not significantly unwound in response to the price pullback suggests that speculative funds have not fully exited. Conversely, for gold to attempt further gains, we will want to see not only price recovery but also continued growth in this net long position. A simultaneous price rebound and COT increase would be a strong signal. If the price recovers but the net position shrinks, it would be easier to judge the rebound as fragile.
④ Macro Factors Check
This week's macro environment presented a mixed picture for gold. The DXY is at 118.7294, a low level corresponding to the 79.3rd percentile. This level supports gold prices. However, the three-month change is +0.31%, indicating that the dollar has not been consistently weak recently. The clear dollar-weakening trend that had previously supported gold has slightly diminished.
We should pay particular attention to interest rates. The US 10-year nominal interest rate is 4.42%, the real interest rate proxy is 1.96%, and the 3-month rate has risen slightly to +1.03%. The rebound in real interest rates is a headwind for gold. On the other hand, the breakeven inflation rate is 2.46%, which is the 3-year 99.73 percentile, and WTI is at $99.89, which is the 3-year 98.92 percentile, indicating considerable inflationary pressure. The VIX is 18.81, not at extreme fear levels, and high-yield OAS is also stable at 2.82. This week, gold is not being bought as a “safe-haven asset during crises,” but rather reflects the reality of “strong inflationary pressure being offset by the rebound in real interest rates, which is capping the upside.”
⑤ Supply and Demand and Sentiment
This week's related article count was 32. The raw score of the auxiliary indicator, avg_raw_score, is positive at 0.928109, however, the primary indicator, site-adjusted sentiment, remains negative with a weekly average of -0.195 and a latest value of -0.21. Despite the positive raw score, a divergence remains, with site-adjusted sentiment leaning bearish. While positive elements appear in article headlines, the underlying market tone, after accounting for the characteristics of the distribution sites, remains cautious.
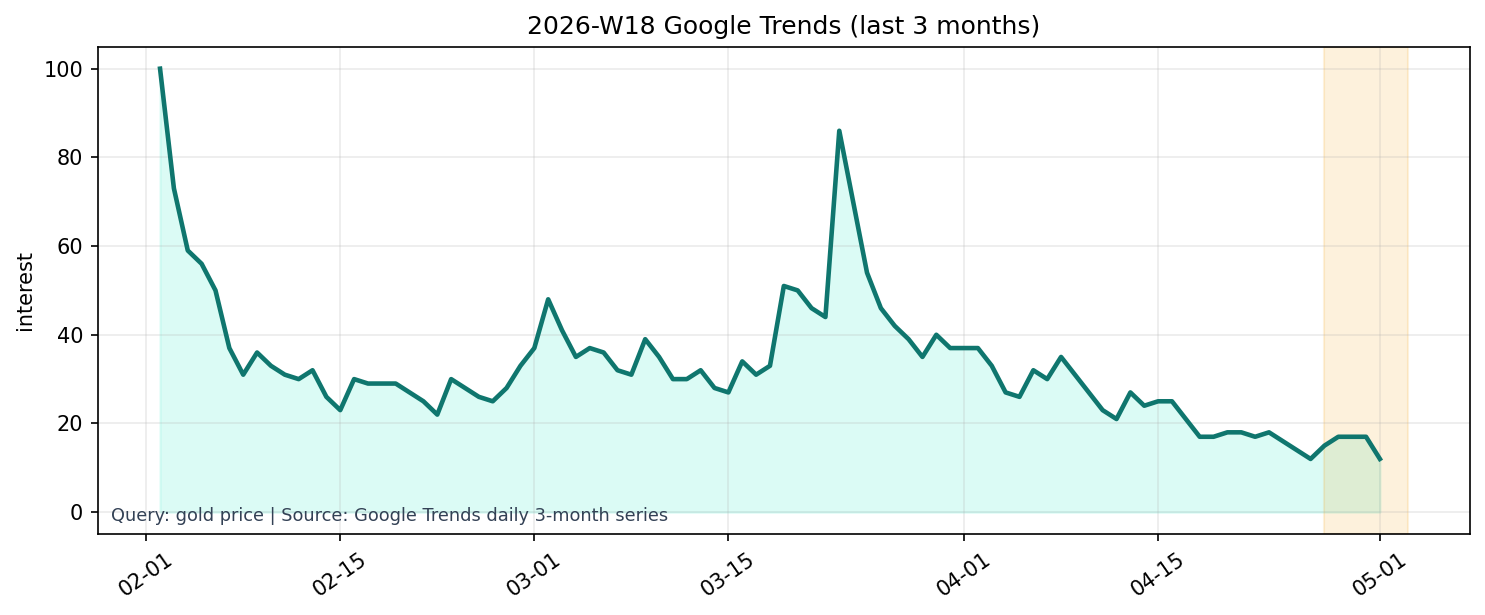
Source: Google Trends daily 3-month series (gold price).
Google Trends is showing further cooling. The 3-month series for gold price is 12, down -29.41% week-over-week, and at the 3-year 1.26 percentile. The 1-year series also remains at 22, down -4.35% week-over-week, and at the 3-year 30.65 percentile. It is important to note that despite high prices, search interest remains largely subdued. The Commitment of Traders (COT) data is light, search activity is weak, and sentiment is still negative. Combining these three factors suggests that the current gold market is not at a peak of enthusiasm, but rather is characterized by participants remaining on the sidelines.
⑥ This Week's Insights and Next Week's Key Points
The core focus this week is that despite the price decline, the underlying supply and demand balance hasn't completely deteriorated. While the weekly -1.57% pullback appears weak, the COT net position increased to 95,141, and the closing price remained at the 91.60 percentile over three years. This indicates that selling pressure isn't as widespread as the market's appearance suggests. On the other hand, the real interest rate proxy rebounded to 1.96%, and the adjusted sentiment indicator fell to -0.195. The conditions aren't entirely favorable enough to immediately buy any dips with a bullish conviction.
Here are four key points to watch out for next week. First, can the market maintain a closing range around 4,633.80? Holding this level would allow us to treat this recent decline as a buying opportunity. Second, will the COT net position of 95,141 continue to increase? Simultaneous price recovery would support an improvement in supply and demand. Third, will the real interest rate proxy of 1.96% decline again? This is crucial for gold to rise steadily. Fourth, can Google Trends (3-month series) of 12 reverse? A return of search interest would make it easier to confirm participation not only from speculators but also from retail investors.
The base scenario is, "Gold prices remain at high levels, but macroeconomic support has weakened from last week." Therefore, next week, we should differentiate between conditions where a dip-buying rebound functions and conditions where the correction lingers. Conditionally, if real interest rates stabilize, the Commitment of Traders (COT) report shows accumulation, and sentiment indicators return to near zero, this week’s decline is likely to end as a healthy correction. Conversely, if real interest rates rise further and search interest remains weak, the week will be susceptible to selling pressure due to the high price level. The focus should be less on the direction itself and more on whether we can see "who is still buying.