Gold sees a brief respite in its rise, but the downtrend remains unbroken. This week focuses on assessing the quality of the correction.
① Weekly Summary
The gold price for 2026-W20 fell from an opening price of $4,729.5 to a closing price of $4,591.1, resulting in a weekly decline of -2.93%. While this appears weak compared to the previous week (2026-W19), which saw a gain of +2.87%, the overall level remains high, with the closing price's three-year percentile at 89.7 and a one-year return of +43.8%. Therefore, it is more natural to interpret this as a pause within an upward trend, driven by profit-taking at high levels and headwinds from interest rates, rather than a breakdown of the trend itself.
Meanwhile, positioning remains far from overheated. As of May 5th, the CFTC’sマネーマネージャー・ネット stood at 94,254 contracts, an increase of +4,502 contracts from the previous week, but the 3-year percentile remains at 27.1. This combination of high prices and light speculative positioning leaves room for a bullish trend in the medium term. This week's decline is viewed not as the end of a bull market, but rather as an adjustment driven by short-term fluctuations in interest rates and the dollar.
② Price Trends and Chart Analysis
*Source: Stooq end-of-day spot close series (xauusd / xagusd).
The week's trading range was substantial at $205.1, representing a 4.34% change from the opening price. The high reached $4,765.2, and the low was $4,560.1, indicating a wide trading range for the week. However, the 20-day annualized volatility remained at 18.34%, placing it at the 43.3rd percentile over one year. It's important to note that the perceived volatility did not match the extent of the price movement; the decline felt more like a readjustment of positions near the high rather than a panic-driven collapse.
The three-month gain/loss rate was -8.04%, and short-term momentum has slightly worsened compared to the previous week. However, it continues to maintain a high price level at the 89.7th percentile over three years, and the upward trend remains intact over a longer time frame. The market’s focus has shifted from “further price gains” to “whether it can maintain the current high levels,” as the market was pushed back from last week’s closing price of $4,712.5 to this week’s $4,591.1. If the market does not clearly break below the support level around $4,560, there is still ample opportunity for a resumption of the upward trend.
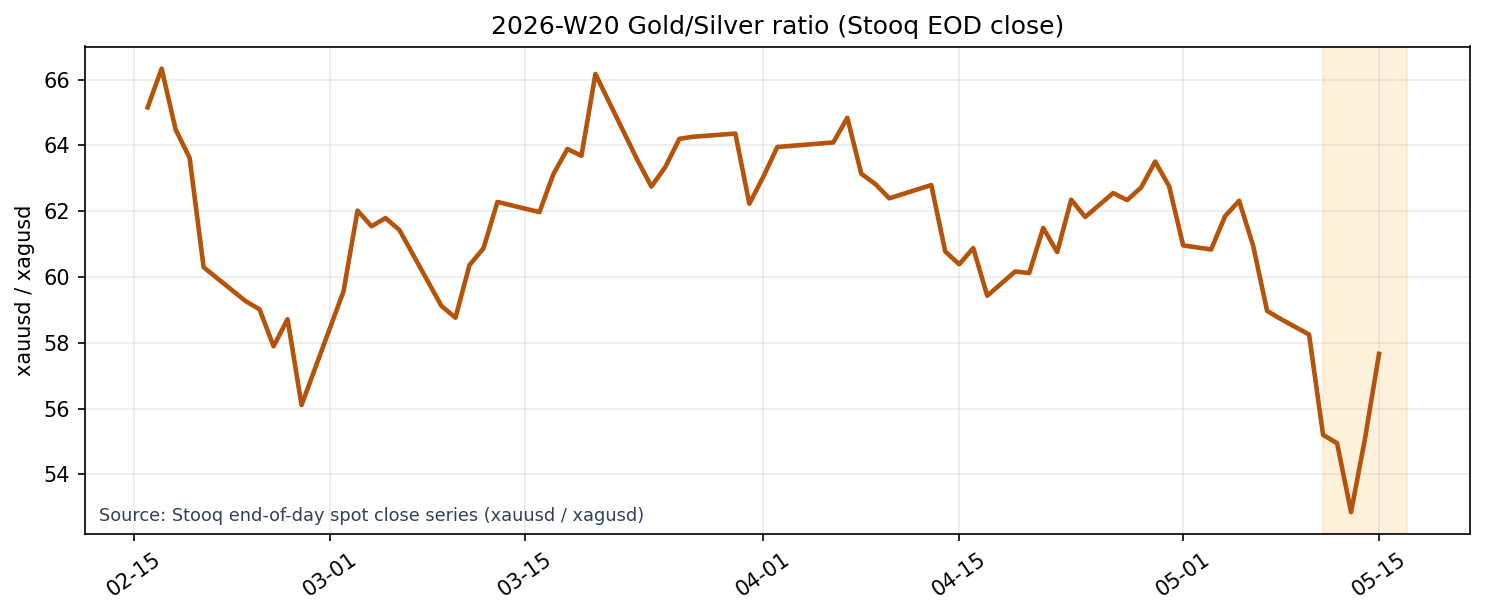
The gold-silver ratio is 57.66, a -1.01% change from the previous week and a relatively low position at the 3rd percentile. This indicates that silver has been outperforming gold recently. This data supports the view that while gold itself may be experiencing downward pressure, investor interest in the precious metals sector as a whole has not diminished.
③ Position Trends
Speculative positioning remains relatively light compared to current high price levels. Money managers' net positions are 94,254 contracts, up from 89,752 the previous week, but still at the 17.65th percentile for the past year and the 27.1st percentile for the past three years. The fact that positions remain low even during price declines suggests that the current strength isn't being driven by a significant unwinding of excessive speculative positions, but rather that a substantial accumulation of bullish positions has yet to occur.
This is clearly illustrated when comparing it to the previous week: while W19 saw prices rise alongside a decrease in COT net positions, W20 experienced falling prices with an increase in COT net positions. This indicates that price and position direction are diverging. This suggests that market participants remain cautious, with a degree of short-covering and repositioning on dips. In an overheated bull market, a high COT position would be vulnerable to a sharp decline, but the current situation has not progressed to that point.
④ Macro Check
The primary headwind in the short term is interest rates. The US 10-year nominal interest rate is 4.46%, the 10-year breakeven is 2.47%, and the resulting real interest rate proxy is 1.99%. While there has been little change on a weekly basis, the real interest rate has risen by +12.43% over the past three months, which is a clear drag on gold. Despite gold maintaining its high levels, the weakness seen in the latter half of the week cannot be ignored in light of this rise in real interest rates.
However, the dollar presents a different picture. The DXY is slightly rebounding, up +0.02% on a weekly basis at 118.04, but remains relatively low with 1-year percentile at 8.2 and 3-year percentile at 4.57. This is not a phase of strong structural dollar appreciation, and therefore not a fatal headwind for gold. The VIX is settling at 17.87, and high-yield OAS is also low at 2.82%, indicating it is not a market driven by credit stress. In short, this week's gold decline appears more like an adjustment from a high-price range under high real interest rates, rather than a broad sell-off driven by post-crisis risk aversion.
To add to this, WTI crude oil rose to $101.56, a level corresponding to the 98.38th percentile over the past three years, which is quite high. While concerns about inflation could potentially benefit gold in the medium to long term, currently, the high nominal and real interest rates are having a greater impact. Therefore, rather than expecting an immediate rebound in gold solely due to rising oil prices, it is important to first observe whether real interest rates will plateau.
⑤ Sentiment and Search Trends
The number of news articles was 36, an increase from 24 the previous week, but the strength of the content weakened. The average raw score was 0.718, down from 1.408 the previous week. The weekly average sentiment, adjusted for site, was -0.40, and the latest value was -0.33, a deterioration from the previous week's -0.315 and -0.22. Despite an increase in the number of articles, the sentiment remains weak, suggesting a week of "attention, but not overwhelmingly positive.
Source: Google Trends daily 3-month series (gold price).
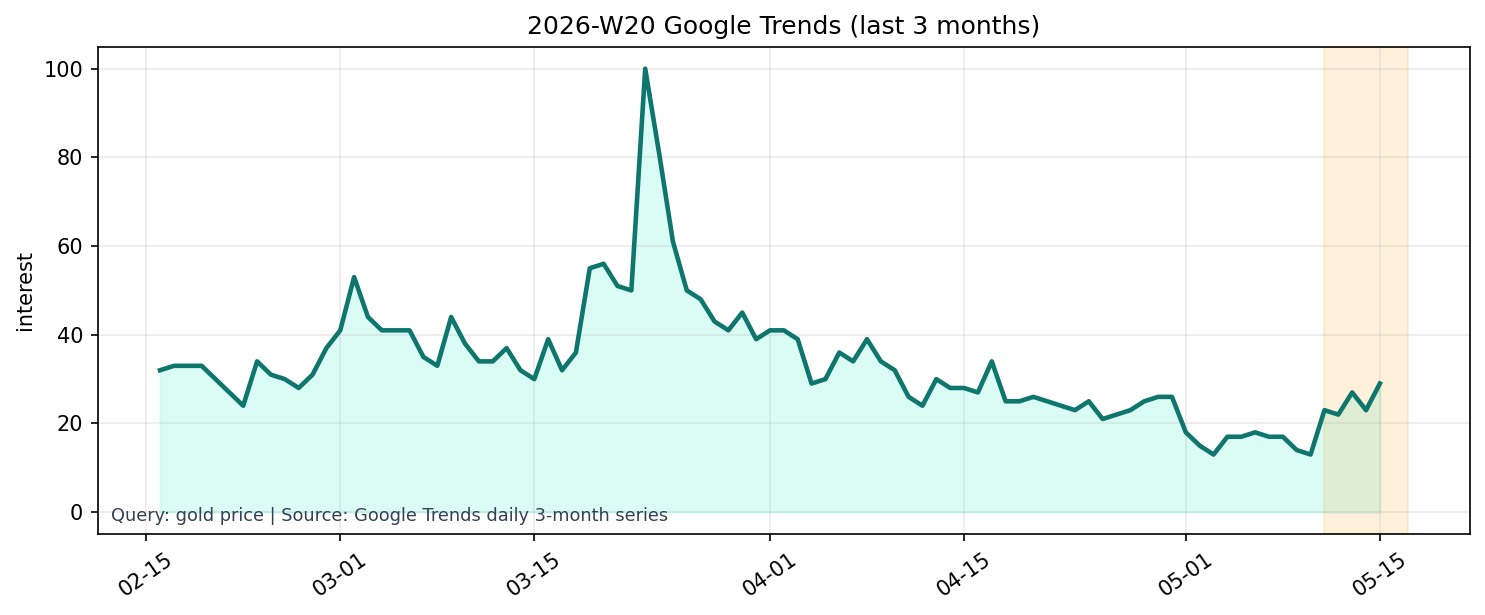
Google Trends also shows the same image. The 3-month series for gold price is 29, recovering from the previous day and week, and the 1-year series rose to 27. However, the 1-year percentile is 25.0, and 35.94 for the 3-year period. Search interest is rebounding, but remains far from a state of frenzy. Despite prices being in a high range, sentiment and search activity are not overheated, so the bubble-like characteristics on the supply and demand side remain subdued.
⑥ This Week's Hypothesis and Key Points to Confirm
This week's hypotheses are four. First, a decline to ¥4,591 is likely a rate-sensitive adjustment rather than a trend reversal. Second, as Commitment of Traders (COT) data remains at low levels, there is still room for funds to re-enter on dips. Third, the combination of deteriorating sentiment and a rebound in search activity suggests the market is entering a period of waiting for the next catalyst, without having fully succumbed to bearish sentiment. Fourth, as indicated by the gold-silver ratio decline, interest in precious metals overall is being maintained, and gold has not been completely abandoned.
The key points to watch going forward next week are clear. First, will the real interest rate proxy rise further from 1.99%, or will it plateau? Second, can prices defend the low zone around $4,560? Furthermore, if prices stabilize while COT (Commitment of Traders) net positions return to around 100,000 contracts, it will be a more visible signal of buying on dips. Conversely, if real interest rates continue to rise but COT positions do not increase and sentiment does not improve, a consolidation period in the high price range is likely to be prolonged. Our current overall judgment is "Maintain a medium-term bullish outlook, but be cautious of continued short-term adjustments.