Gold Rebounds, But Optimism Is Still Hard to Justify: How to Read the Weight of Real Rates
① One-Sentence Summary This Week
Gold for 2026-W30 rebounded from an opening price of $4,003.4 on Monday to $4,052.9 as of July 24th, resulting in a weekly gain of +1.24%. Last week (W29), we highlighted whether the price could defend the “near $4,000 level” and whether real interest rates would continue to rise. As it turned out, the price held above $4,000, and CFTC COT money manager net longs increased to 120,779 contracts. However, the U.S. 10-year real interest rate proxy rose to 2.39%, with the 1-year percentile at 100.00 and the 3-year percentile at 97.99. Therefore, this week’s conclusion is: “The price has bounced back, but real interest rates are too heavy to commit to a resumption of the uptrend. Next week will be a test of whether it can maintain the $4,050 range and assess its resilience to rising interest rates.”
② Price Trends and Chart Review
This week's price data is from the yfinance futures series. The weekly opening price was $4,003.4, the closing price was $4,052.9, the daily high reached $4,152.1, and the low was $3,999.7. The weekly range was $152.4, representing a 3.81% increase from the opening price. Recovering from the previous week (W29) closing price of $4,002.0, and successfully avoiding a close below $4,000 is a straightforward positive factor.
However, the price positioning remains a mixed picture of "strong" and "still damaged." While the year-end percentile is not high at 29.50, the three-year percentile stands at 76.32, indicating a continued presence in relatively high valuation territory when viewed over a longer timeframe. The three-month return is -13.31%, an improvement from the previous week W29's -16.74%. Conversely, the one-year return remains positive at +21.43%, suggesting that the long-term upward trend has not completely collapsed.
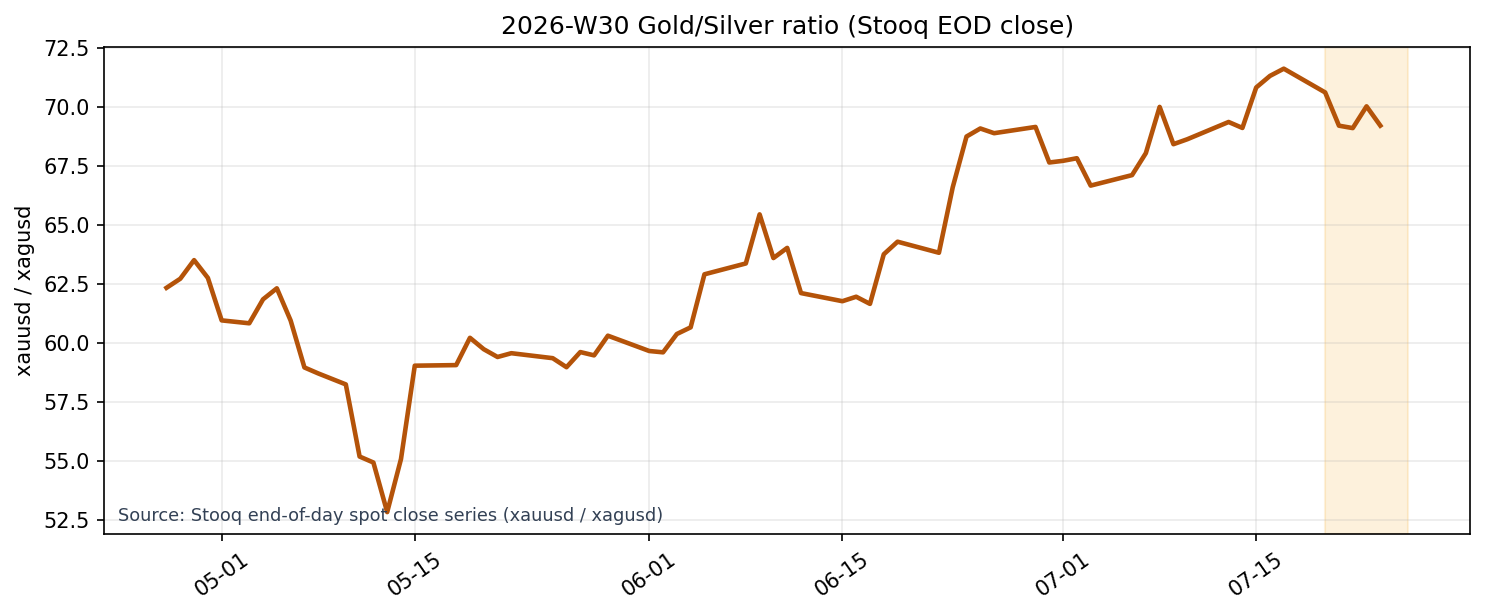
*Source: Stooq end-of-day spot close series (xauusd / xagusd).
The annualized volatility for 20 years is 22.46%, with a 1-year percentile of 51.34 and a 3-year percentile of 78.51. It's near neutral over the past year, but remains relatively high over three years. The gold/silver ratio is 69.20, down 3.36% week-over-week, with a 3-year percentile of 20.08. Gold is being comparatively pressured against silver, and there's a mix of risk preference within the precious metals sector. The gold/WTI ratio is 47.53, with a 3-year percentile of 63.29, and decreased 1.18% week-over-week. It remains relatively high against oil but has declined from W29's 50.47.
The recent rebound in gold prices appears less like a return of independent momentum and more like a correction following selling exhaustion around the $4,000 level. This adjustment is occurring while re-evaluating its relative relationship with silver and crude oil. Maintaining support above $4,050 would confirm a price floor; however, a renewed breach of $4,000 would postpone the recovery from the three-month downtrend.
③ Investor Activity of Institutional Investors
The latest available CFTC COT data is as of July 14, 2026. As price data lags, it does not directly reflect movements from the latter part of this week but serves as a baseline for speculator positioning.
Money manager longs totaled 136,905 contracts, shorts totaled 16,126 contracts, and the net long position was 120,779 contracts. The increase from the previous value was +4,618 contracts. The one-year percentile of the net position is 64.71, and the three-year percentile is 45.16. Speculative traders slightly increased their positions compared to the previous week (W29) when the net long was 115,395 contracts, with a one-year percentile of 57.14 and a three-year percentile of 43.14.
This change indicates that speculators have not completely exited around the $4,000 level. However, the 3-year percentile of 45.16 remains moderate. Despite prices being at relatively high levels over the past three years, the Commitment of Traders (COT) report does not indicate overheating. For bullish interpretations, there is potential for additional buying room if the upward trend resumes. Conversely, given that the COT is moderate while real interest rates are extremely high, speculative forces alone have limited ability to push prices higher unless macro conditions improve.
As a supplementary indicator, the 60-day beta relative to QQQ is 0.54, and the 252-day beta is 0.05. In the short term, it exhibits some sensitivity to fluctuations in the stock market, but it is not a substitute for high-tech stocks in the medium term. This week as well, it remains advisable to prioritize the dollar and real interest rates over a risk-on equity strategy.
④ Macro Factors Check
The macroeconomic environment has become somewhat heavy, contrary to price rebounds. The DXY is at 120.5315, up +0.17% from the previous value, +1.68% over three months, and at the 68.03 percentile for one year. Rather than a clear decline in the dollar pushing gold prices higher, it appears to be suppressing gold's upside potential.
U.S. 10-year nominal interest rates are at 4.67%, with the 1-year percentile at 100.00 and the 3-year percentile at 96.65. The 10-year breakeven is 2.28%, with the 1-year percentile remaining at 32.66 and the 3-year percentile at 33.87. As a result, the 10-year real interest rate proxy has risen to 2.39%, with the 1-year percentile at 100.00 and the 3-year percentile at 97.99. This represents a further deterioration from W29’s 2.32% and is a clear headwind for gold.
The risk environment is not in crisis mode. The VIX is at 16.64, with a 1-year percentile of 40.78 and a 3-year percentile of 53.05. US HY OAS is at 2.68%, with a 1-year percentile of 4.21 and a 3-year percentile of 6.76, indicating no significant stress in credit markets. WTI is at $84.38, with a 1-year percentile of 71.72 and a 3-year percentile of 83.81. Crude oil prices are elevated but distinct from the kind of financial stress that would trigger a rush to safe-haven assets like gold.
Essentially, this week's gold price rebound wasn’t so much driven by “risk aversion” as it was by a sense of value around the $4,000 level and increased buying from speculators. However, the headwind from rising real interest rates has likely only intensified.
⑤ Supply and Demand and Sentiment
The number of articles related to gold was 33. The average raw score based on the number of articles was 0.665136, an improvement from 0.452333 in the previous week (W29). On a daily basis, July 20th recorded a score of 0.699525, followed by 0.263750 on July 21st, 0.420200 on July 22nd, and 1.484333 on July 23rd, indicating a strengthening tone in news coverage towards the end of the week. Top tags were “企業” (companies) with 27 mentions, "金融" (finance) with 26, "地政学" (geopolitics) with 22, "投資フロー" (investment flows) with 22, and "需給" (supply and demand) with 19. This week saw gold prices influenced not only by price movements themselves but also by corporate performance, investment flows, and geopolitical factors.
Site-adjusted sentiment was +0.0125 on a weekly average, and +0.19 most recently. This represents a clear improvement from the previous week (W29), which had a weekly average of -0.225 and a recent reading of -0.15. However, the weekly average remains near zero, indicating it is not uniformly bullish. While pessimism has receded, optimism has not yet returned to a widespread level.
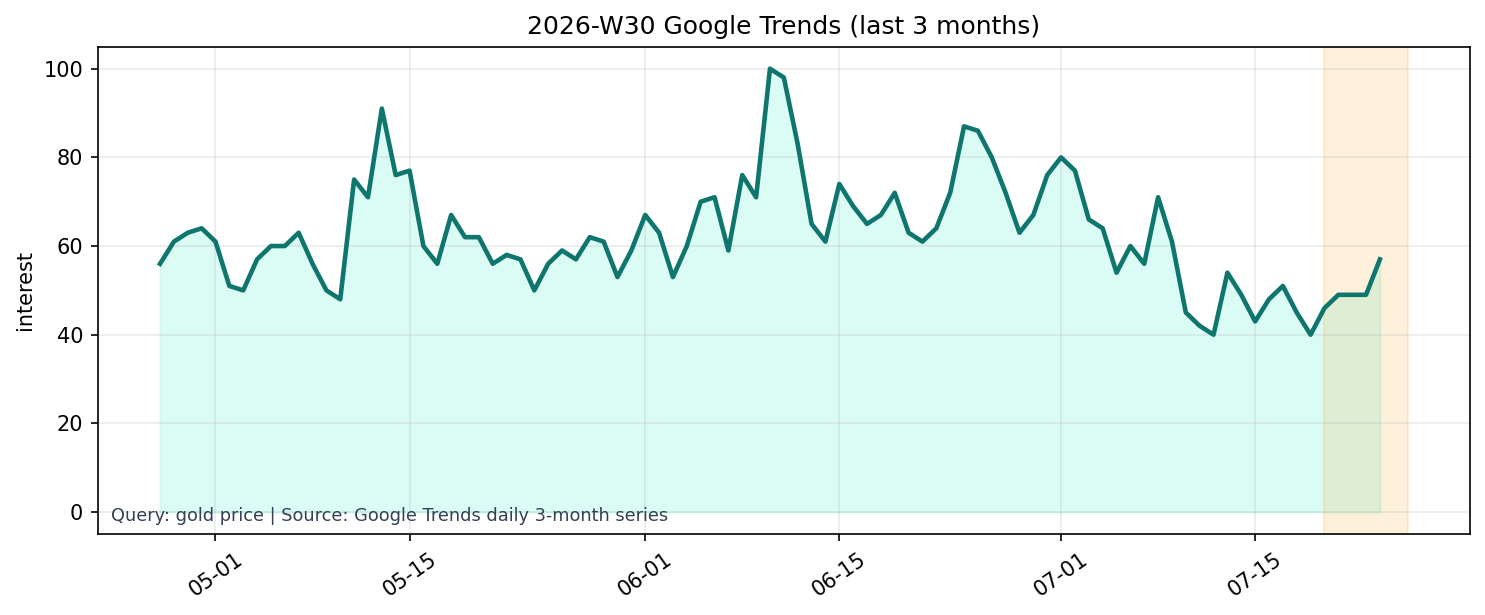
Source: Google Trends daily 3-month series (gold price)
Google Trends data for gold price is currently at 57.0 over a three-month period. This represents a slight decrease from W29's 59.0, but shows a daily increase of +16.33% and a three-month change rate of +1.79%. The one-year series stands at 24.0, with a week-over-week decrease of -4.00% and a one-year percentile of 3.85. Short-term searches are slightly retreating, while broad investor interest remains relatively low.
This supply and demand dynamic, along with market sentiment, provides some support for bargain buying. The Commitment of Traders (COT) data shows increased buying, news sentiment is improving, and search demand remains moderate rather than exuberant. However, the weekly average sentiment is near zero, and the one-year search series also sits at a low level, so we have not yet seen a significant increase in participation to accelerate the upward trend.
⑥ This Week's Insights and Next Week's Key Points
Our previous W29 hypothesis stated that "gold would temporarily stabilize around $4,000, but a resumption of the upward trend would require either a decline in real interest rates or a reversal in the dollar." The first half of this week proved accurate, while the second half remains unfulfilled. Prices rebounded, defending the $4,000 level, and sentiment improved. However, real interest rates rose from 2.32% to 2.39%, and the dollar has remained firm.
Next week’s base scenario is "Gold can maintain the ¥4,000 level, but upside will be muted unless real interest rates decline." There are three conditions that would shift the outlook to bullish. First, sustaining a closing price in the ¥4,050 range and retesting weekly highs of the ¥4,150 range. Second, a decrease in the 10-year real interest rate proxy from 2.39%. Third, a temporary peak of +0.19 on adjusted sentiment proving to be just that, with a clear positive trend maintained on a weekly average basis.
Conversely, the conditions for revising to a bearish stance are also clear. If gold were to close below $4,000 again, real interest rates remain stubbornly around 2.4%, and sentiment reverts to negative territory, then this week's rebound would likely be merely a corrective bounce within a downtrend. While there’s no need to definitively predict a sharp decline as the Commitment of Traders (COT) isn't showing excessive positioning, we believe it is premature to adopt a bullish stance based solely on price rebounds given the current heavy interest rate environment.