Gold prices fell 3.07% for the week, while the Commitment of Traders (COT) report showed an increase of 3,099 contracts, suggesting a potential rebound from the recent decline.
① One-sentence summary for this week:
Gold fell this week from $4,673.4 to $4,529.9, with a weekly change of -3.07%. However, CFTC net longs increased by 3,099 contracts from the previous week, and site-adjusted sentiment was slightly positive at a weekly average of +0.0214. While the price adjusted, the core issue this week is that institutional investor and news sentiment have not completely collapsed.
② Price Trends and Chart Review
Weekly prices were in the futures series, with a week-opening price of $4,673.4 on August 24, and a closing price of $4,529.9 on August 28. The week's high was $4,755.0, and the low was $4,495.0. The price moved $260.0, with a range from the week-opening price of 5.56%, and a weekly gain/loss rate of -3.07%. After testing the high, selling pressure emerged, and the closing price was near the week's low. In W32, the maintenance of the $4,300 range was the observation point, but this time the price held the $4,500 range, and the price band itself has shifted upward.
The closing price is in the high range, at the 87.40 percentile over the past 3 years. The 3-month return is nearly flat at +0.52%, but it maintains +31.21% over 1 year. The 20-day annualized volatility is 23.95%, the 80.85 percentile over the past 3 years. Rather than an end to the uptrend, it appears that the trading range has widened at a high price level, making it easier for profit-taking to occur.
Spot relative prices use Stooq’s end-of-day closing price series. The gold-to-silver ratio is 67.62, up +0.35% week-over-week, and the 18.64 percentile over the past 3 years. Gold was slightly dominant against silver, but remains at a level where silver is favored in the long term. The gold-to-WTI ratio is 53.56, down -0.20% week-over-week. Crude oil movements did not offset the fall in gold.
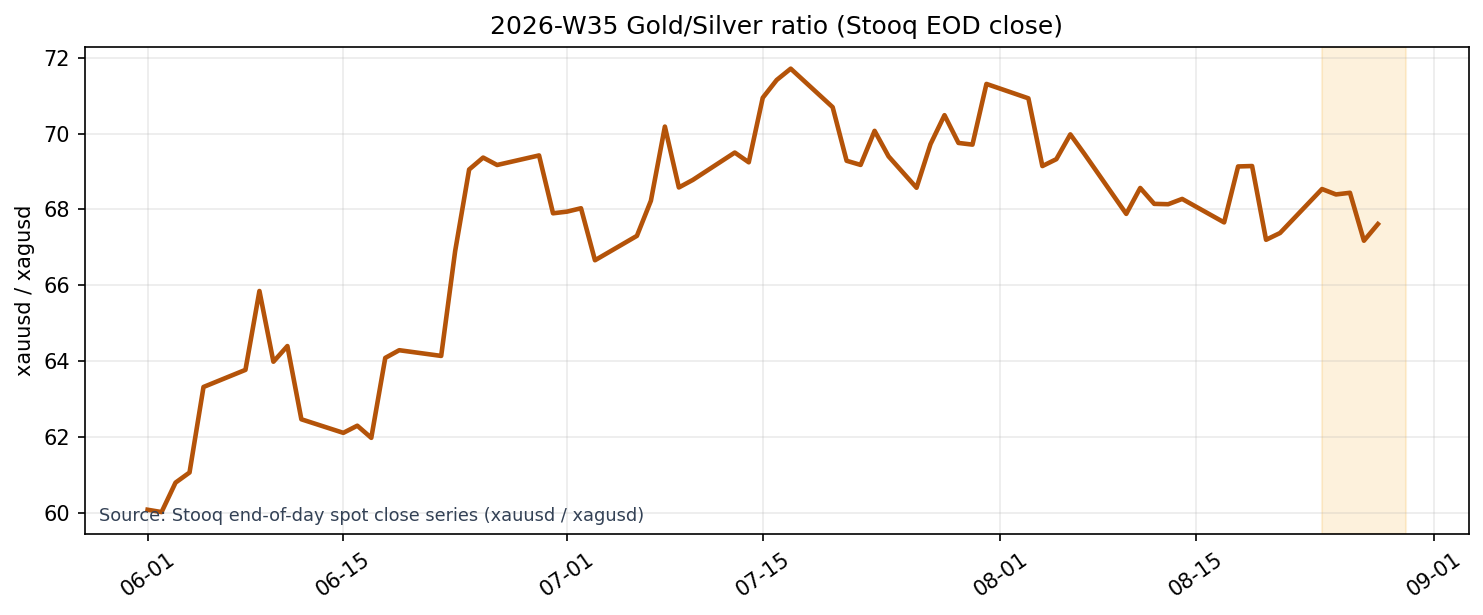
Source: Stooq end-of-day spot close series (xauusd / xagusd).
③ Investor Activity
The latest available CFTC COT data is as of August 25. Money managers' long positions were 159,819 contracts, short positions were 15,072 contracts, and the net long position was 144,747 contracts. This represents an increase of 3,099 contracts from the previous week. Despite prices falling throughout the week, speculators did not reduce their long positions but rather increased them.
Net positions are at the 90.38 percentile over the past year. While not at a level to definitively declare overheating, positions have been substantial over the last year. Therefore, while an increase in Commitment of Traders (COT) data may support a floor, a breach of $4,500 could trigger liquidation of accumulated buy orders, potentially widening the trading range.
Previously, with the W32 contract, the issue was that prices were leading while net long positions were 119,795. This time, the net long position has increased to 144,747, a change reflecting that institutional investors are now following the price increase. However, as the COT data is as of Tuesday, it does not fully account for potential price declines later in the week. Whether the next release shows continued increases or a reversal to decreases will be important.
④ Macro Factors Check
The macro environment is sending conflicting signals regarding the dollar and interest rates. The DXY is at 118.7479, with a 3-month change of -0.35% and a 1-year change of -1.21%. This is a low level, at the 7.61 percentile over the past 3 years, and the dollar level tends to support gold.
Meanwhile, the US 10-year nominal interest rate is 4.73%, the breakeven is 2.31%, and the real interest rate is 2.42%. The real interest rate is at the 97.33 percentile over the past 3 years, clearly weighing on gold holdings. VIX is 14.43, and US HY OAS is 2.60%, indicating low market stress. There is no sudden surge in demand for safe assets.
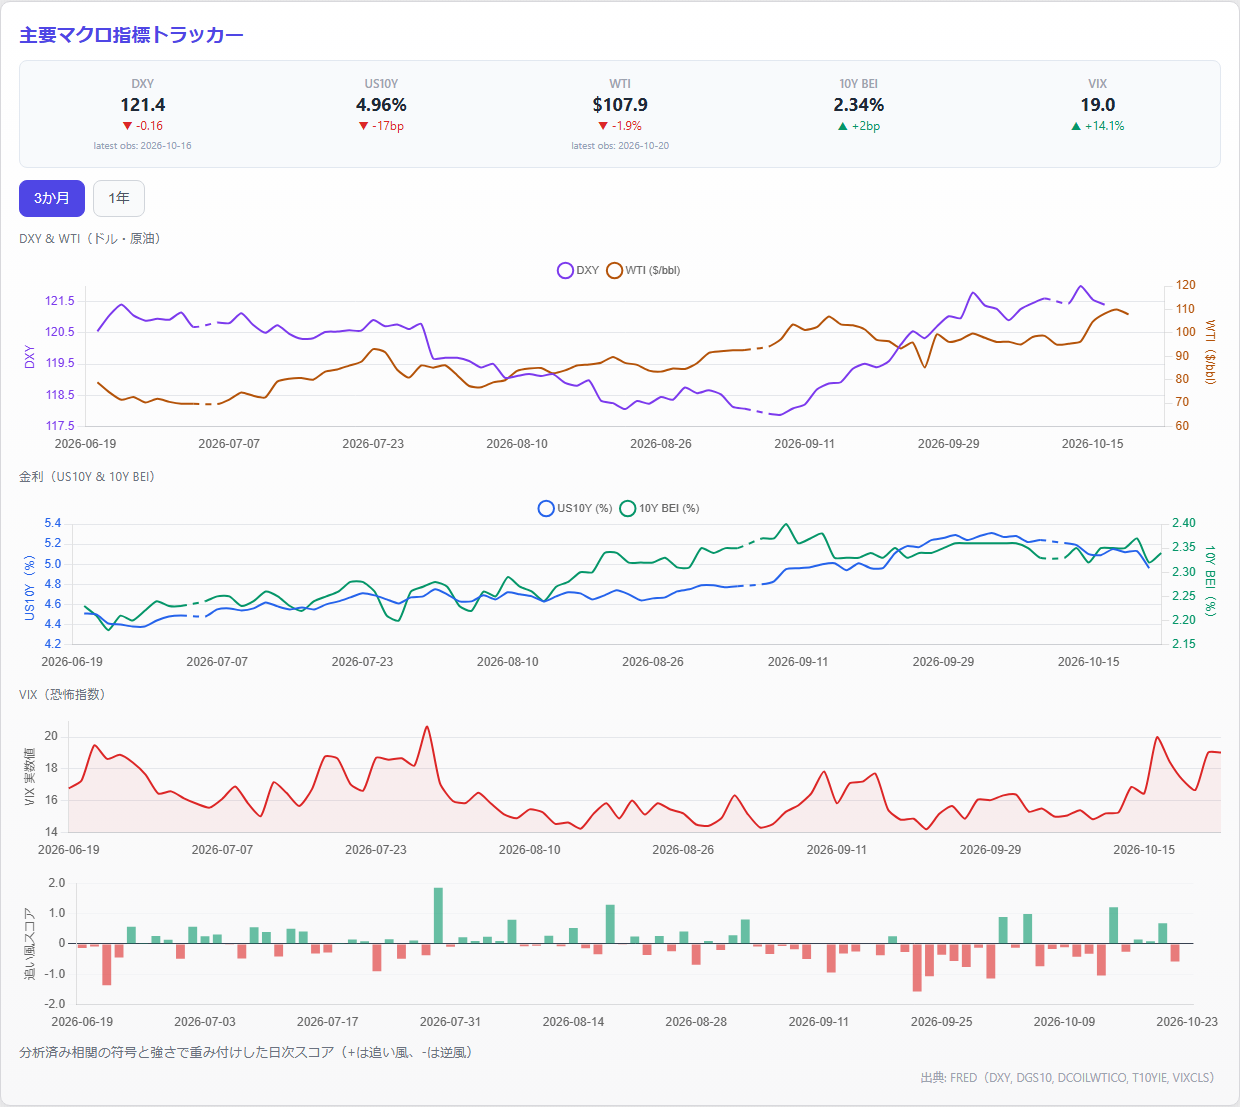
This week’s fall can be more naturally explained as a combination of a stronger dollar and profit-taking at high levels, rather than solely by dollar appreciation. The dollar's weakness provides support, while real interest rates continue to cap the upside, a pattern unchanged from the previous instance.
⑤ Supply and Demand and Sentiment
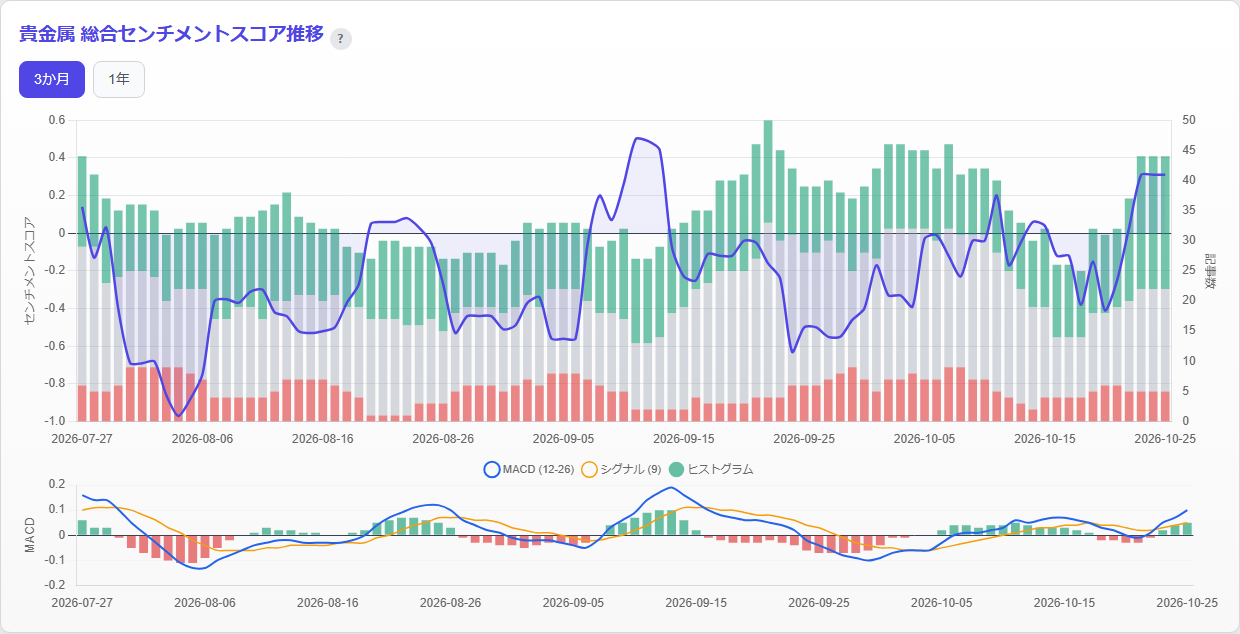
Gold-related articles numbered 24, with an average raw score of +0.524188. The tone turned upward in the latter half of the week, with the average raw score on August 28 being +1.39025. However, the sentiment of the main indicator, after site adjustment, was -0.06 recently, compared to a weekly average of +0.0214. While the week as a whole was slightly positive compared to neutral, caution returned towards the end.
Google Trends' "gold price" has a 3-month series value of 66, down -12.00% from the previous day, and is at the 63.57 percentile over the past 3 years. The 1-year series is 35, up +12.90% from 31 the previous week. Short-term daily search interest paused over the weekend, but weekly search interest is increasing. While there may be increased activity checking prices in response to the price fall, we cannot determine bullish demand based solely on increased search interest.
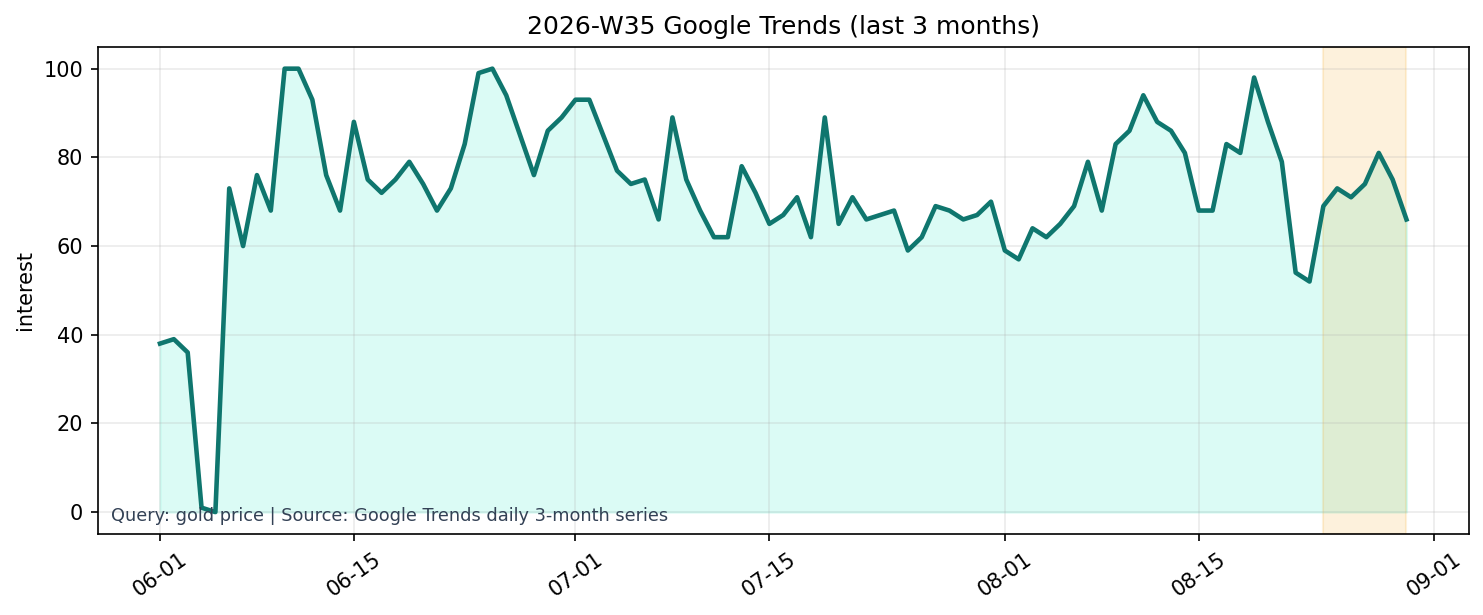
Source: Google Trends daily 3-month series (gold price).
COT buying has been slightly positive on a weekly average, and increased search interest over the past year indicates that demand has not disappeared even during adjustment phases. However, COT positions are substantial over the past year, and the adjusted sentiment indicator is currently negative. Supply and demand are firm, but optimism has not spread.
⑥ This Week’s Insights and Next Week’s Key Points
Previously, with the W32 timeframe, we noted maintaining the $4,300 level, a re-increase in COT data, and an improvement in adjusted sentiment as observation points. This time, the price has broken higher to 4,529.9 dollars, COT has increased to 144,747 contracts, and weekly average sentiment has recovered to +0.0214. These three conditions have progressed directionally. However, the weekly decline was 3.07%, and the immediate sentiment is -0.06. It is necessary to consider the breakout of the price range and the current adjustment separately.
Next week’s primary point of observation is $4,500. Maintaining this level on the closing price, and if it can return toward the weekly high of 4,755, it will allow for an easier interpretation of this week’s decline as an adjustment within the high price range. Conversely, if $4,500 is clearly breached, and the COT net long position decreases from 144,747 contracts, it can be judged that institutional investor support has weakened.
Second is real interest rates. A decline from 2.42% would, combined with a low DXY, help support gold prices. If they remain high, even with a low dollar, the bounceback will likely be slow. Third is sentiment. We will monitor whether corrected sentiment recovers from -0.06 to zero, and whether search interest is maintained on a weekly basis. Until prices, COT, and sentiment all improve simultaneously, we will refrain from confirming a resumption of the uptrend and will measure the depth of the adjustment based on $4,500 this week.