Gold prices fell 2.1%, with a decrease of 5,727 COT contracts and a worsening of market sentiment.
① One-sentence summary for this week:
Gold prices fell 2.1% on a weekly basis, COT net longs decreased by 5,727 contracts, and adjusted news sentiment also deteriorated to a weekly average of -0.2471. The "resilience to headwinds" seen in the previous week has not continued, and prices, institutional flows, and sentiment are all contributing to a weakening adjustment phase.
② Price Trends and Chart Review
This week's gold futures reference values fell from $4,413.0 on Monday, September 21st, to $4,321.2 on Friday, resulting in a weekly change of -2.0802%. The high for the week was $4,422.1, and the low was $4,278.3. The trading range was $143.8, or 3.2586% from the week's opening value. While the price rebounded $42.9 from the low, it failed to recover the opening value and ended in a form that erased last week’s +1.1406% gain.
Previously, we highlighted recovery of the 4,500-dollar level close, a decline from the real interest rate of 2.68%, and an increase in COT net longs as observation points. The results were a closing price of 4,321.2 dollars, a real interest rate of 2.83%, and a COT decrease of 5,727 contracts, with none of these improving. While prices rebounded despite adverse conditions last week, this week’s inability to maintain that resilience was the biggest difference.
The closing price is up +6.9895% compared to three months ago and +14.7207% compared to one year ago, with the medium-term uptrend still remaining. The level is at the 79.18th percentile over the past three years, and a prolonged uptrend cannot be said to have disappeared based on this week’s decline alone. On the other hand, the 20-day annualized volatility is 17.5216%. Over the past year, it is at the 12.98th percentile, and over the past three years, it is at the 56.17th percentile, showing a significant difference in appearance, indicating a shift to a more volatile regime in the most recent year.
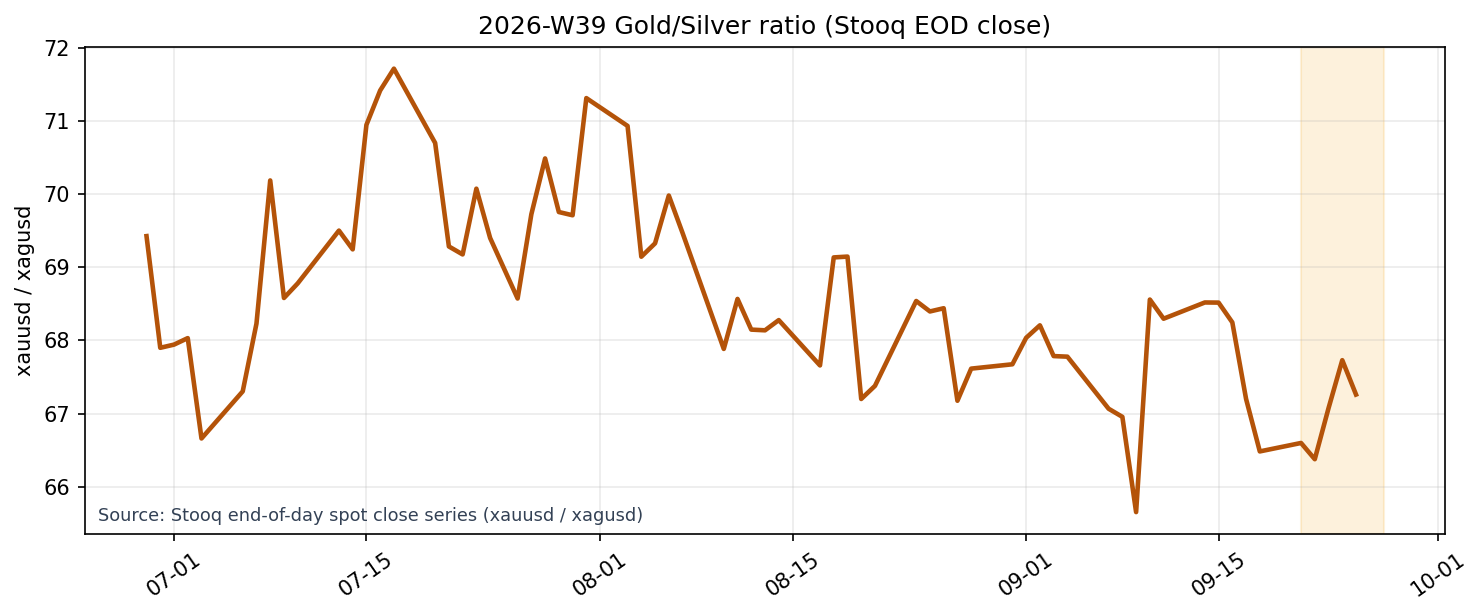
Source: Stooq end-of-day spot close series (xauusd / xagusd).
The chart uses Stooq’s end-of-day closing prices. The gold-silver ratio is 67.2613, up +1.1693% from the previous week. While the relative comparison of gold and silver favored gold, this does not indicate that gold was strong, but rather suggests that silver’s weakness was more pronounced during the downtrend. The gold-to-WTI ratio was up +16.2299% from the previous week, primarily due to WTI’s sharp decline to $85.23.
③ Investor Activity
CFTC COT (as of September 22) showed money managers holding 135,699 long contracts, 8,310 short contracts, and a net long position of 127,389 contracts. This decreased from the previous week’s 133,116 contracts, representing a 5,727 contract reduction and the third consecutive week of decline. Details show longs decreased by 6,695 contracts, while shorts also decreased by 968 contracts. The net reduction was primarily driven by a reduction in bullish positions rather than a surge in new short selling by bearish investors.
Net positions are at the 75.00 percentile over the past year, still within the top quartile. However, unlike previous weeks, the situation is not one of "weak flows but resilient prices" as both price declines and long positions decreased simultaneously. While a substantial long position remains, it is yet to be confirmed whether this thickness will continue to support the floor. Next time, we would like to examine not only net positions but also whether the rate of decrease in long positions slows or shorts begin to accumulate again.
④ Macro Factors Check
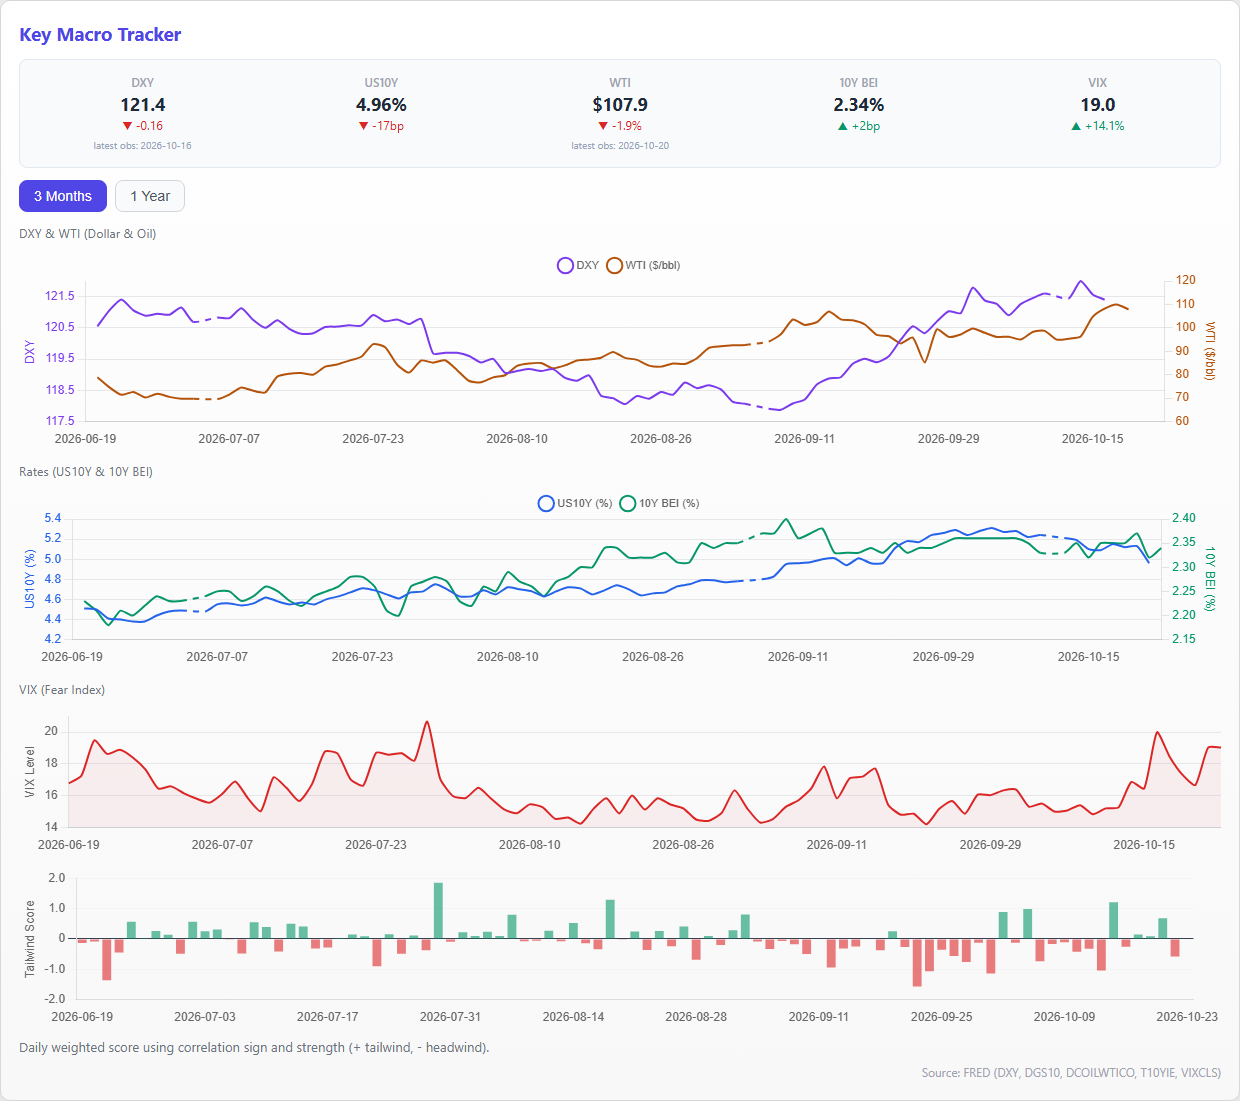
Gold faced headwinds due to the interest rate environment. As of September 25th, the U.S. 10-year nominal interest rate was 5.17%, the breakeven inflation rate was 2.34%, and the real interest rate was 2.83%. This represents an increase of 0.15 points from the previous week's 2.68%, which suppressed gold's relative attractiveness. The DXY also remained at a high level of 120.33, providing no clear tailwind from the dollar.
Meanwhile, the VIX settled at 14.87, and there has been no strong flight-to-safety demand. WTI crude oil prices plunged from $95.88 per barrel in the previous observation to $85.23, making it difficult for gold demand driven by inflation concerns to gain momentum. This week, it appears that high real interest rates and the dollar environment have taken precedence over the "safe-haven gold" narrative.
⑤ Supply and Demand and Sentiment
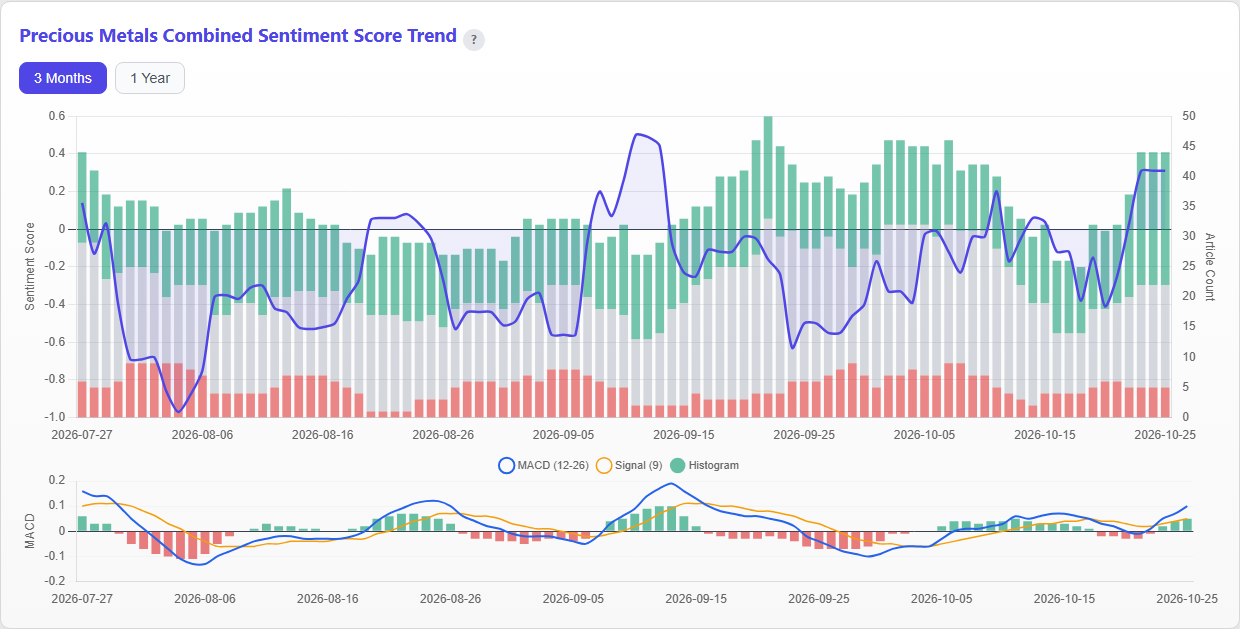
This week’s gold-related articles totaled 38. Site-adjusted news sentiment was -0.2471 on a weekly average, with the most recent value at -0.49. The weekly average of +0.0686 and the most recent +0.05 from the previous week both turned negative, and deteriorated gradually from +0.11 at the beginning of the week to -0.49 by the end of the week. The adjustment this week was supported by surrounding indicators as price declines, COT reduction, and worsening news sentiment moved in the same direction.
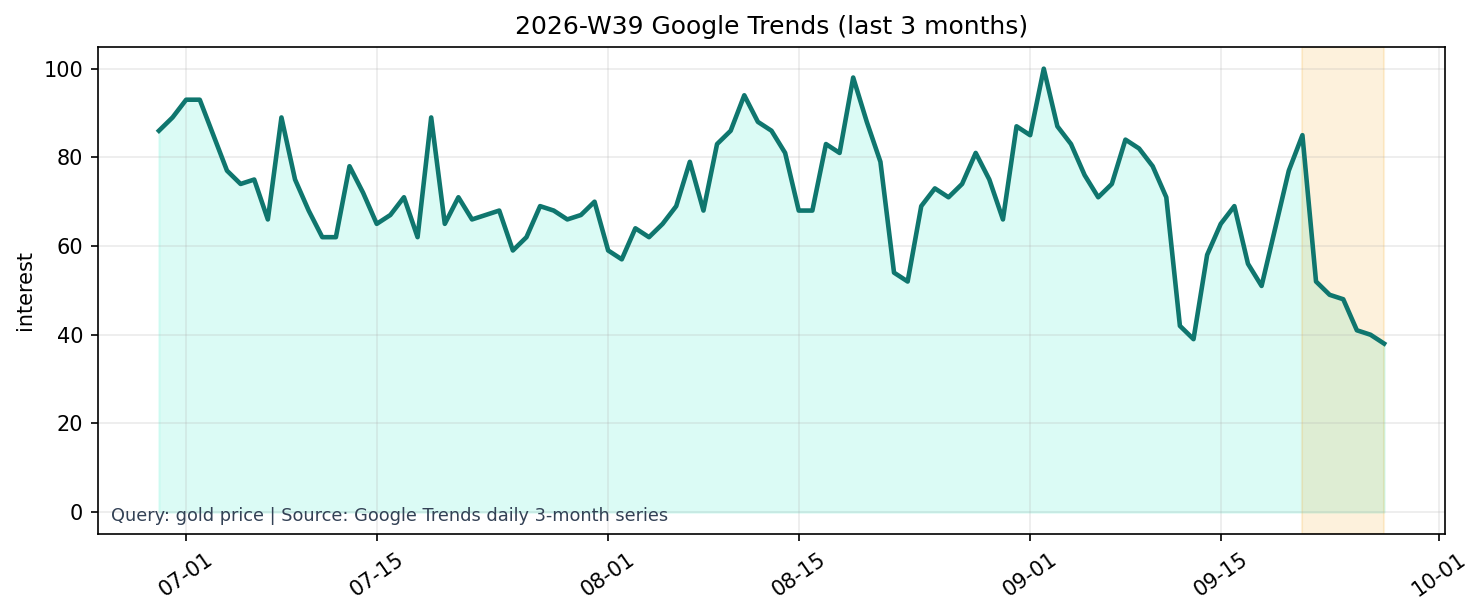
Source: Google Trends daily 3-month series (gold price).
Google Trends' "gold price" shows a recent value of 38 for the 3-month series, down -5.0% from the previous day. On the other hand, the 1-year series was 23, up +9.5238% from the previous week's 21. Daily search interest weakened over the weekend, but weekly search interest has increased slightly. However, the 1-year series value of 23 only reaches the 5.66 percentile over the past year, suggesting that general interest has not spread to an enthusiastic level. While attention to price adjustments is increasing, it does not appear to be a case of a sudden expansion in the breadth of participation.
⑥ This Week’s Insights and Next Week’s Highlights
The core focus this week is the resolution of the "discrepancy between price and peripheral indicators" that had persisted until the previous week, aligning in a weak direction. Gold prices fell by -2.0802%, COT net longs decreased by 5,727 contracts, and adjusted sentiment was -0.2471 on a weekly average. Furthermore, real interest rates rose to 2.83%. While prices rebounded last week despite weak COT data and sentiment, this week, even that price-based resilience has broken. This change needs to be tracked as a potential shift in the quality of the adjustment, rather than dismissed as a one-day fluctuation.
Nevertheless, medium-term price levels and institutional investor long positions have not disappeared. The closing price is approximately 7.0% higher than it was three months ago, and COT net longs are at the 75.00 percentile over the past year. Therefore, there is insufficient evidence this week alone to determine a shift in the long-term trend. The next focus will be whether short-term deterioration ends with portfolio rebalancing or progresses to a chain reaction of weakening prices, flows, and sentiment.
Next week, we want to confirm three points. First, whether this week's low of $4,278.3 can be maintained and whether the price can close above the $4,400 level. Second, whether real interest rates will head lower from their current level of 2.83%. Third, whether the decrease in COT net long positions will moderate and whether adjusted sentiment will return from negative territory. If the price breaks below $4,278.3 and both COT positions and sentiment continue to deteriorate, we would likely assess that the correction has deepened. Conversely, if the low is maintained while any of the following improve – interest rates, flows, or sentiment – we could revise our view of this week’s decline as a healthy consolidation.
The gold-silver ratio can also be used as a reference line. If the ratio continues to rise, there is a possibility that a relative defensive stance favoring gold over silver remains, rather than a recovery in precious metals as a whole. If the ratio declines and simultaneously COT data and sentiment stabilize, it could be a sign that demand is beginning to return to the entire precious metals sector. Avoid rushing to conclusions; we want to see where the three indicators that worsened together this week will reverse.