Gold prices fell 3.5%, weighed down by a reduction of 7,071 contracts in the Commitment of Traders (COT) report and a real interest rate of 2.92%.
① One-sentence summary for this week:
Gold prices fell 3.5% for the week, and Commitment of Traders (COT) net long positions decreased by 7,071 contracts. Real interest rates rose to 2.92%, and adjusted news sentiment remained in negative territory. The adjustment that has continued from the previous week has progressed to a phase that involves not only price but also weakness in holdings and the macro environment.
② Price Trends and Chart Review
This week's gold futures reference values fell from $4,315.0 on Monday, September 28th, to $4,162.3 on Friday, October 2nd, resulting in a weekly change of -3.5388%. The daily high during the week was $4,315.6, and the low was $4,143.1. The trading range was $172.5, or 3.9977% from the week's opening value. Prices trended downwards throughout the week, and the rebound from the low only reached $19.2. This marks a two-week downward adjustment, following last week’s -2.0802% decline.
Previously, we monitored whether the price could maintain its low of $4,278.3, whether real interest rates would decline from 2.83%, and whether Commitment of Traders (COT) data and adjusted sentiment would stabilize. The results showed that the price breached $4,278.3, real interest rates rose to 2.92%, and COT decreased by 7,071 contracts. Adjusted sentiment improved from -0.49 the previous week to -0.19 recently, but the weekly average remained negative at -0.2657. Therefore, the condition that last week’s adjustment would end with simple portfolio rebalancing has not been met as of this week.
The closing price was pushed back to nearly flat, down -0.1248% compared to three months ago, while maintaining +7.1122% compared to one year ago. Based on the closing price distribution over the past three years, it is at the 74.68 percentile, which is around the upper quarter when viewed over a longer period, but the current trend is clearly weak. The 20-day annualized volatility is 16.6574%. Over the past year, it is at the 9.16 percentile, and over the past three years, it is at the 52.06 percentile, a significant difference indicating that the volatility regime differs between the most recent year and the period prior.
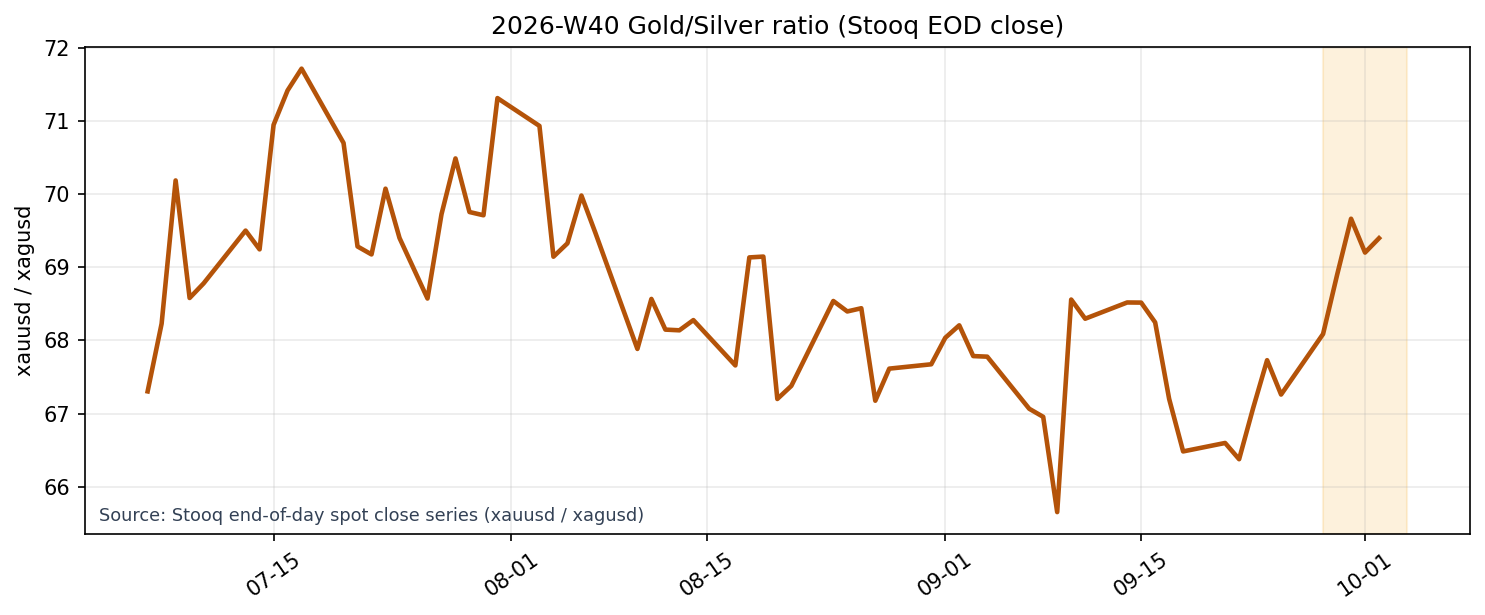
Source: Stooq end-of-day spot close series (xauusd / xagusd).
The chart uses Stooq series EOD closing prices. The gold-silver ratio is 69.3983, up +3.1772% from the previous week. Gold itself fell, but was relatively firm against silver. The gold-to-WTI ratio is 42.5202, down -16.1345% from the previous week. Gold's relative value compared to energy decreased significantly as WTI rose to $97.89.
③ Investor Activity
CFTC COT (as of September 29) showed that money managers held 131,711 long contracts, 11,393 short contracts, and a net long position of 120,318 contracts. This decreased from the previous week's 127,389 contracts, representing a 7,071 contract reduction and the fourth consecutive week of decline. The breakdown shows a decrease of 3,988 long contracts and an increase of 3,083 short contracts. Last week primarily involved long positions being liquidated by bullish investors, but this week saw a further weakening of position changes due to both long liquidation and an increase in short positions.
Net positions are above the median for the past 1 year at the 63.46 percentile, not indicating extreme overbuying. While a buying position remains, prices are falling and net long positions are shrinking simultaneously, so it is premature to consider this position as support. Next time, it will be necessary to confirm not only whether the net decrease stops, but also whether the shorts that increased this week will further accumulate.
④ Macro Factors Check
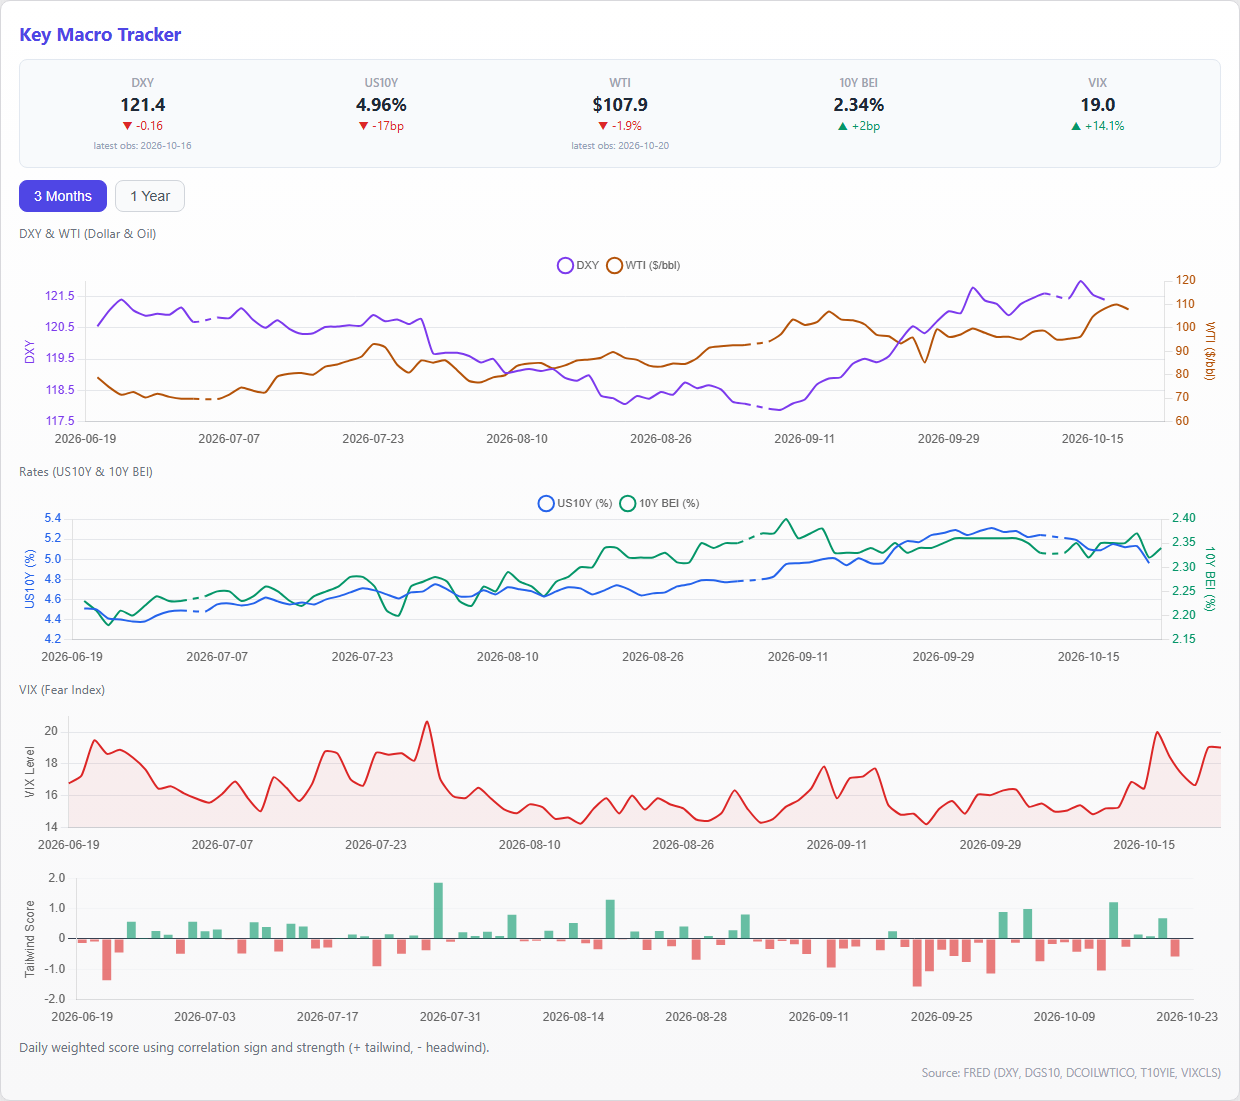
The primary drag on gold was interest rates. The US 10-year nominal interest rate on October 2 was 5.28%, with a breakeven inflation rate of 2.36%, resulting in a real interest rate of 2.92%. This was up from the 2.83% previously observed, suppressing gold’s relative attractiveness. The DXY remained at a high level of 121.3848, and the slight decrease of 0.3312% from the previous observation was not enough to provide a tailwind for gold.
Meanwhile, the VIX is at 15.31, indicating a calming of volatility and a lack of immediate demand for safe assets. WTI rose to $97.89, but inflation expectations remained flat at 2.36%, failing to exert downward pressure on real interest rates. This week, the formation of prices was more influenced by the rise in nominal and real interest rates than by the slight decline in the dollar.
⑤ Supply and Demand and Sentiment
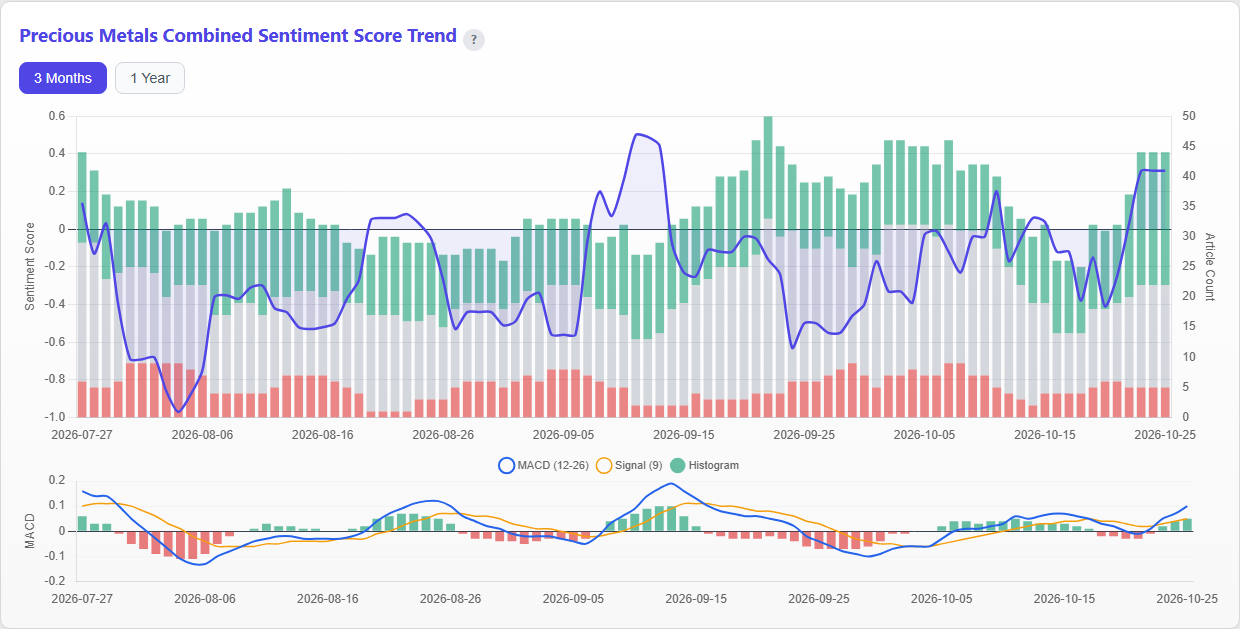
This week’s gold-related articles totaled 44. Site-adjusted news sentiment averaged -0.2657 for the week, with the most recent value at -0.19. It improved from -0.50 at the beginning of the week to -0.11 as of October 1st, and remained higher than the previous week’s -0.49. However, it did not move out of negative territory, and optimism sufficient to offset the price decline has not returned. In Asia, improving buying demand following the price decline was a major topic, but overall news sentiment remained cautious.
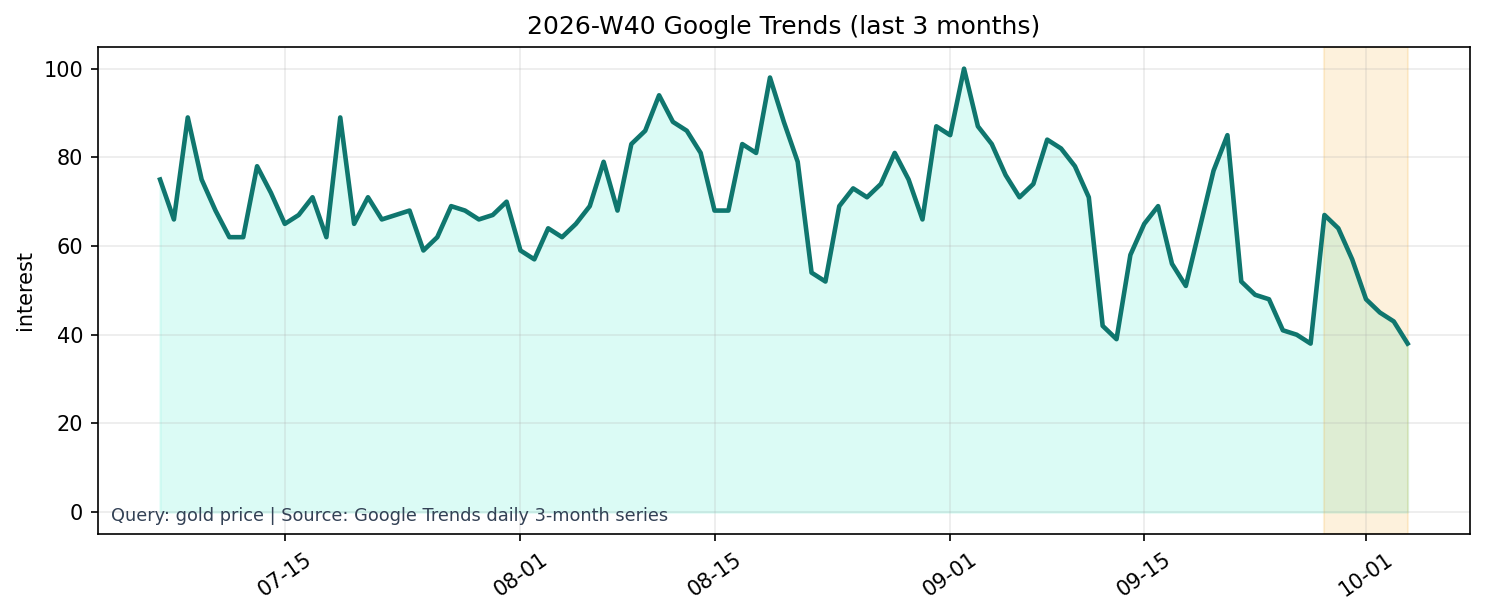
Source: Google Trends daily 3-month series (gold price).
Source: Google Trends (gold price), daily 3-month and weekly 1-year series.
Google Trends' "gold price" shows a recent value of 38 for the 3-month series, down -11.6279% from the previous day. The 1-year series is at 19, down -17.3913% from 23 the previous week. The 1-year series value of 19 is at the 1.89 percentile over the past year, and despite significant price declines, search interest has not expanded. COT reduction, post-adjustment sentiment negativity, and low search interest all suggest a lack of supportive factors for increased active participation from a supply and demand/sentiment perspective.
⑥ This Week’s Insights and Next Week’s Highlights
The core focus this week is that many of the conditions for a downturn halt, which we highlighted last week, have been broken, and the quality of the adjustment has weakened. Prices fell -3.5388%, COT net longs decreased by 7,071 contracts, and real interest rates rose to 2.92%. The COT, which was primarily focused on long liquidation last week, accompanied this week’s activity with an increase in shorts. Adjusted sentiment rebounded in the latter half of the week, but has not yet reversed the deterioration in prices and positions.
However, it would be quick to interpret the weak materials as a shift in the long-term trend. The closing price is up +7.1122% year-on-year, and is at the 74.68 percentile within the distribution of levels over the past 3 years. News that physical demand in Asia has improved due to price declines also indicates a small clue of demand reaction in the low-price range. The key is whether such demand can absorb the reduction in futures holdings and high real interest rates.
Next week, we want to confirm three points. First, whether the current week's low of $4,143.1 can be maintained, and whether the closing price can recover to $4,278.3, which was the previous week's low. Second, whether real interest rates will head lower from their current level of 2.92%. Third, whether the decrease in COT net longs will narrow, and whether the adjusted sentiment will return to around zero. If the low is breached, and short covering and real interest rates continue to rise, the evidence supporting a prolonged correction will increase. Conversely, if the price recovers to $4,278.3, or if either interest rates or COT improves, it will be easier to judge that the downward pressure has eased.
It is also important to note search interest. Despite price movements, the 1-year series has fallen to 19, and the current market is being influenced more by changes in interest rates and institutional positions than by the enthusiasm of retail participants. Will prices recover while search interest remains low, or will they be accompanied by a recovery in search interest? Next week, we want to assess not only the direction of prices but also the breadth of participation supporting the rebound.