Gold sees a pause in its rise, but the downtrend remains unbroken. This week focuses on assessing the quality of the correction.
① One-Sentence Summary This Week
Gold fell 3.68% for the week, but the Commitment of Traders (COT) report showed positioning near the lower end of the past three years, and news sentiment improved over the weekend. It appears that investor conviction is being tested under the pressure of high real interest rates, rather than a collapse of speculative fervor.
② Price Trends and Chart Review
This week's gold price, according to the weekly OHLC snapshot (yfinance_futures), started at $4185.00 and closed at $4030.90, resulting in a weekly change of -3.68%. The weekly high was $4211.20, and the low was $4000.90. The weekly range from the opening price was 5.03%, indicating greater intraday fluctuation than the rate of decline. The closing price is at the 66.84th percentile over the past three years, still above the median over a longer timeframe, but falls at the 5.73rd percentile over the past year. This indicates that the price band over the past year has been pushed back to the lower end of its new range after previously rising from a lower level.
20-year annualized volatility is 18.93%. While it sits at the 19.08 percentile over the past year, it’s at the 61.44 percentile when looking at the past three years, showing a different picture. Due to significant fluctuations in the most recent year, this week's price action is described as "calm compared to recently, but somewhat volatile when viewed over three years." Rather than panicking based solely on the -3.68% figure, we want to observe whether selling accelerates near the $4000 level or if it is absorbed.
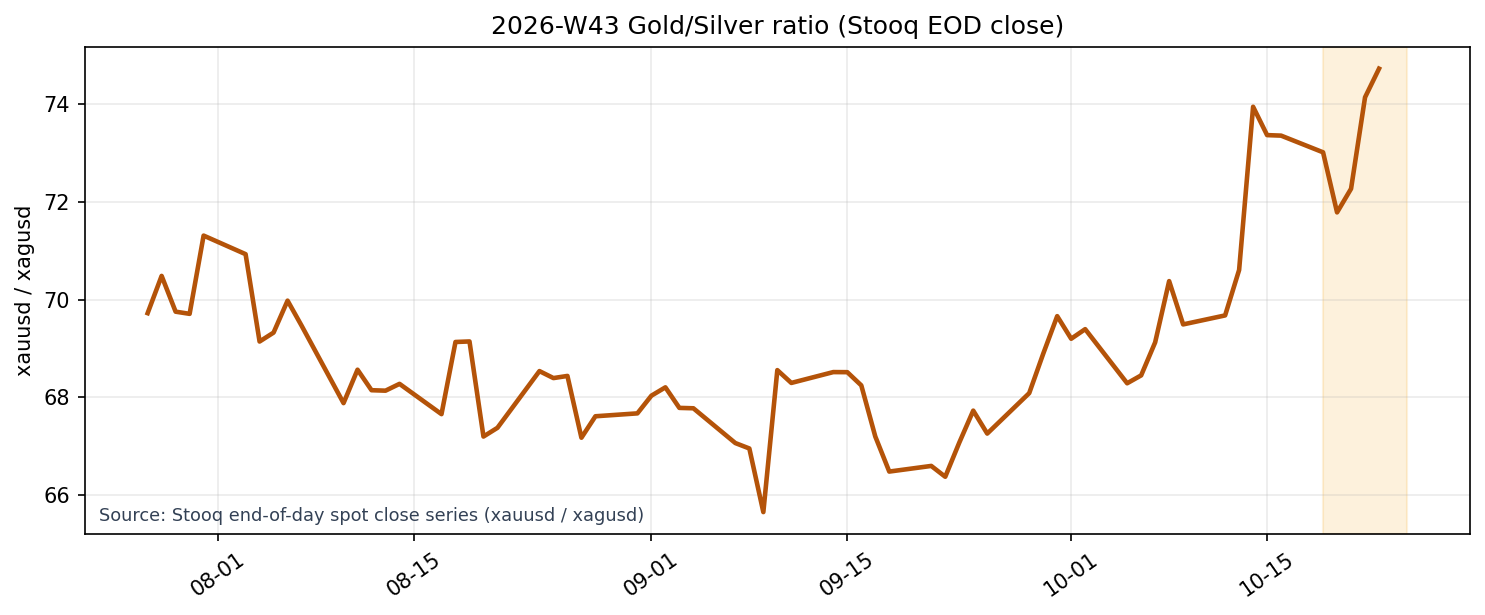
*Source: Stooq end-of-day spot close series (xauusd / xagusd).
The gold/silver ratio chart, used as a reference for spot relative prices, utilizes Stooq's end-of-day (EOD) gold and silver closing series. The gold/silver ratio is 74.73, up +1.87% from the previous week. Gold declined, but held up relatively well against silver, indicating lingering preference for gold as a safe haven. On the other hand, the gold/WTI ratio is 38.40, down -0.63% from the previous week. The advantage of gold over WTI crude oil has slightly diminished. Rather than interpreting this decline as a broad shift away from safe assets, it is more natural to view it as an adjustment reflecting selective buying within precious metals and caution regarding the high-interest rate environment.
③ Investor Activity of Institutional Investors
The latest CFTC COT report (as of October 13) showed money managers holding long positions of 124,747 contracts, short positions of 17,658 contracts, and a net long position of 107,089 contracts. This represents a decrease of 3,898 contracts from the previous week, suggesting that institutional investors were gradually reducing risk prior to the weakening of prices. Total open interest was 396,345 contracts, and the reduction in the net long position should be interpreted not as a "bearish reversal," but rather as a sign of diminished upward momentum.
Levels are at the 26.45th percentile over the past three years. The price decline doesn't indicate a sudden collapse of overbuilt speculative long positions. Rather, positions are relatively light, and the potential for forced liquidations during the downturn is limited. Conversely, without new buying catalysts, fuel for an upward trend is also scarce. Whether the net long position increases again in the next COT report, or if bearishness progresses with increased short positions, will determine the reliability of the battle around the ¥4000 level.
④ Macro Factors Check
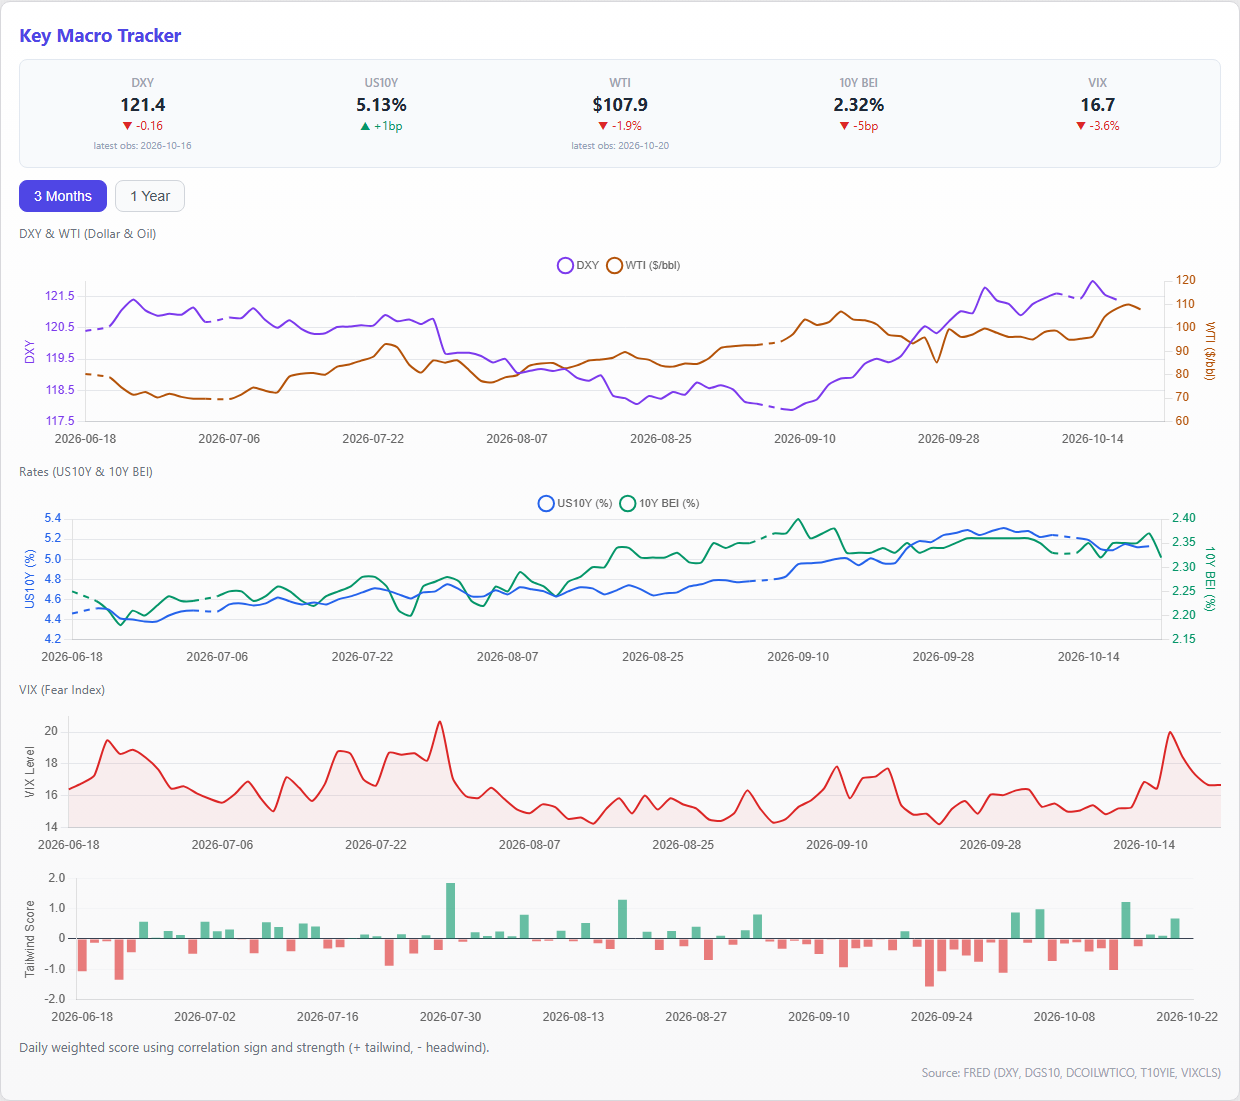
Macroeconomic factors are not straightforwardly favorable for gold. The US 10-year nominal interest rate is 5.13%, and the US 10-year real interest rate proxy is 2.76%, which raises awareness of the cost of holding gold without earning interest. The DXY is at 121.4048, up +0.52% over three months. Due to the strong US dollar and high real interest rates, gold needs supply and demand support to independently rebound.
However, recent observations show that real interest rates have slightly decreased from 2.77% to 2.76%, and the DXY is down -0.14% from the previous day. The VIX is at 16.68, indicating that the level of tension is not strong enough to strongly encourage gold purchases as a hedge against risk. WTI is high at $107.89, while the breakeven inflation rate has fallen to 2.32%. Rather than expecting inflation hedges based solely on high oil prices, we want to prioritize confirming whether "real interest rates will continue to decline.
⑤ Supply and Demand and Sentiment
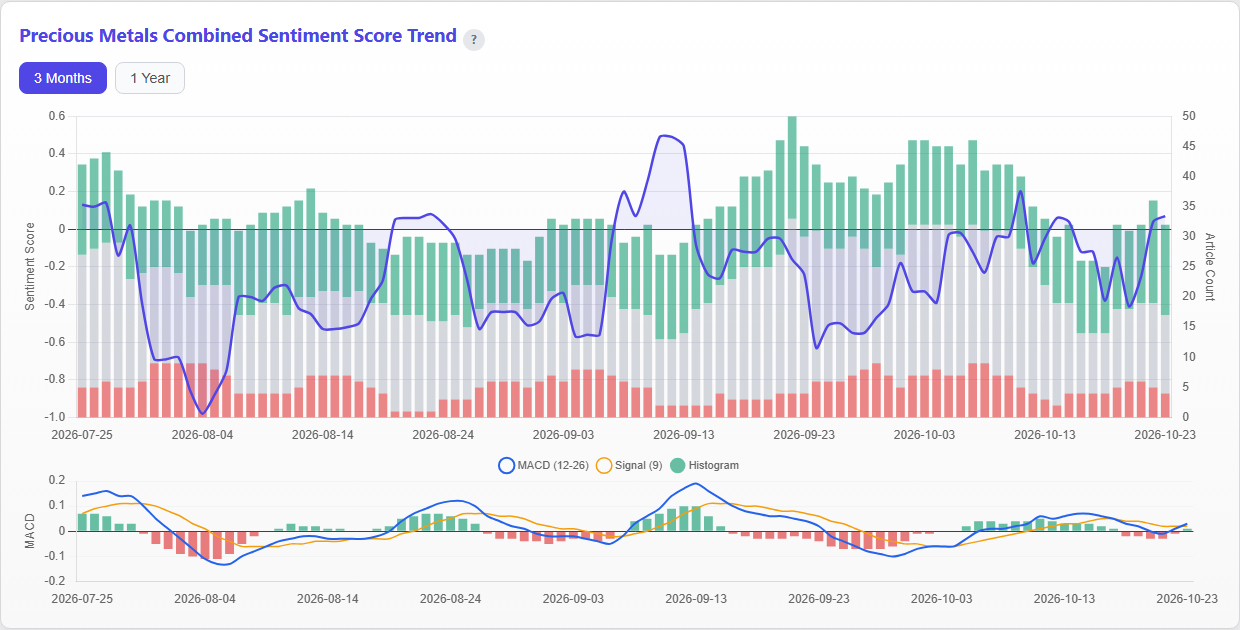
This week's gold-related articles totaled 31. The primary indicator, site-adjusted sentiment, averaged +0.015 for the week, remaining largely neutral. However, daily fluctuations improved from -0.12 on October 19 and -0.16 on October 20, to +0.02 on October 21 and +0.32 on October 22. The recovery in news sentiment following price declines in the latter half of the week represents a small but supportive factor. The supplementary indicator, raw score, averaged +0.9611, but we refrain from concluding a bullish shift due to the influence of site differences.
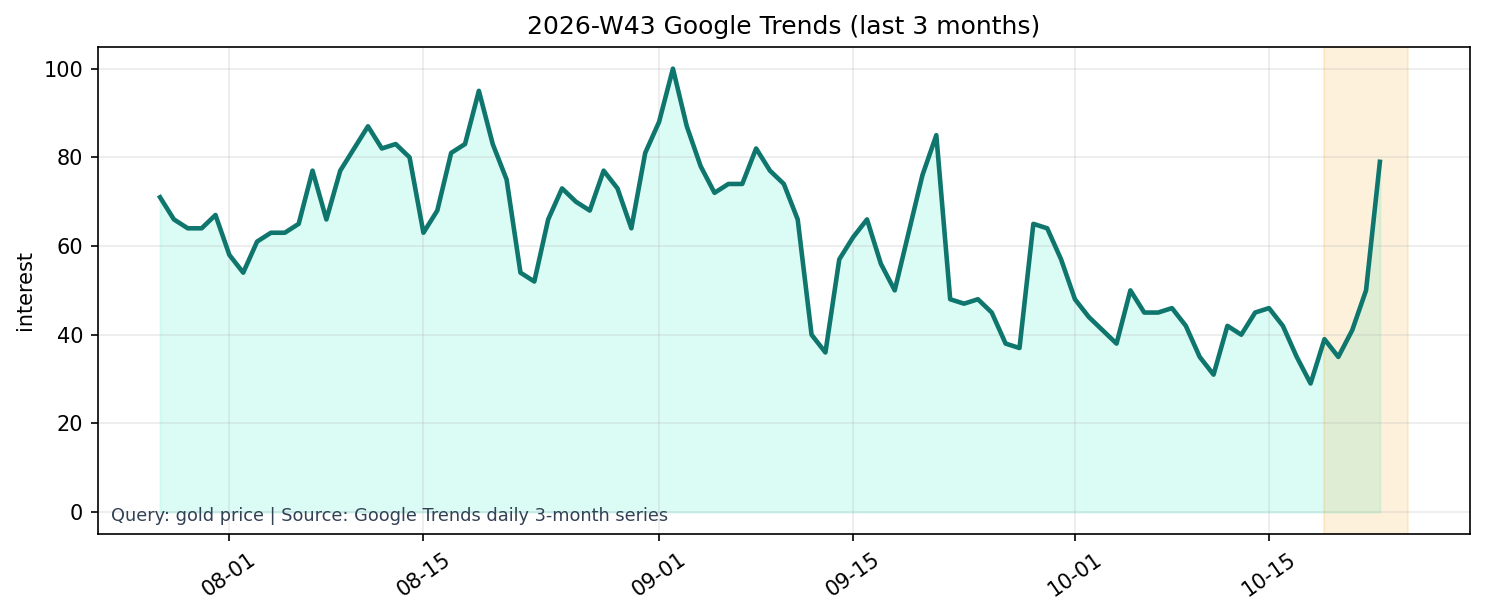
Source: Google Trends daily 3-month series (gold price).
Google Trends data for "gold price" showed a sharp increase of 79 for the 3-month daily series, a +58.00% week-over-week increase. Conversely, the 1-year weekly series remained flat at 18, unchanged from the previous week. While short-term price declines triggered increased search activity, broader public interest has not consistently risen over the year. This discrepancy indicates an increase in "temporary attention to dips" but not a surge into fervor. This aligns with the Commitment of Traders (COT) net long positions, which are relatively low over the past 3 years, suggesting that supply and demand, and market sentiment, are closer to cautious observation than overheating.
⑥ This Week's Insights and Next Week's Key Points
The core focus this week is the divergence between price, positioning, and sentiment. Prices fell by 3.68%, and the COT net long positions decreased by 3,898 contracts. Based on these factors alone, the outlook appears bearish. However, the level of speculative positioning remains light, and the adjusted sentiment recovered to +0.32 by the end of the week, with increased short covering. Therefore, the current situation can be interpreted not as a phase of cascading selling, but rather as a period where buyers are testing whether genuine demand will enter the market at lower prices.
Due to the unavailability of the human-edited version (2026-W42) from the previous week, a comparative analysis using the observation points from the prior report is not possible. There is also no historical data in the provisional database, and this report will be treated as the initial observation within the accumulation loop. Moving forward, we will focus on three combinations next week.
First, consider the $4,000 level and real interest rates. If the closing price maintains above $4,000 and real interest rates decline from the current 2.76%, this week's decline could be a test of the lower range. Conversely, if the price falls below $4,000 and real interest rates re-rise, prioritizing defense over buying on dips would be preferable. Second, observe price action and COT (Commitment of Traders) data. If net longs increase from 107,089 contracts during a rebound, it indicates renewed participation from institutional investors. However, if only the price recovers while COT continues to decrease, the sustainability of the upward trend will be questionable. Third, assess the persistence of market sentiment. If post-correction sentiment advances to a clear positive on a weekly average, and the 1-year Google Trends rises above 18, it suggests that short-term search increases are translating into broader interest.
From an operational perspective, it is important not to base a bottoming decision on a single indicator. The probability of a rebound increases if two or more of the following conditions are met: maintenance of $4,000, a decline in real interest rates, and an increase in COT (Commitment of Traders) positions. Conversely, if the price falls below $4,000 and real interest rates rise simultaneously, sentiment improvement will likely be limited to a contrarian expectation. The absence of euphoria does not necessarily mean there is no room for further declines, but it also suggests that there is still margin for the next upward move.