Gold prices were down 2.8%, but COT holdings increased. It appears selling may be being absorbed.
① One-sentence summary for this week:
Gold fell from $4,012.20 at the start of the week to $3,898.90, resulting in a weekly decline of -2.82%. Following a previous week's decline of 3.68%, the price breached the key level of $4,000 on a closing basis. However, unlike the previous week, speculative net long positions increased by 1,356, and site-adjusted sentiment improved to a weekly average of +0.3017. While the price action appears weak, positioning and sentiment are not overwhelmingly bearish. The focus this week is not on whether the downtrend continues, but rather whether new buyers will absorb selling pressure below $4,000.
② Price Trends and Chart Review
Gold prices were $4,012.20 on Stooq at the start of the week and $3,898.90 on Friday, a decrease of $113.30, or 2.82%. This follows a 3.68% decline the previous week, marking two consecutive weeks of adjustment. Breaking below $4,000 is a bearish factor in the short term, but the decline was smaller than the previous week. 20-day annualized volatility is 19.08%. This is low compared to the 20.61 percentile over the past year, but is the 61.57 percentile over the past three years. Current trends suggest an adjustment to lower levels from a high price zone, rather than a panic.
In last week’s article, we set “Can we defend $4,000?” as the primary observation point. The result was a breach of that level based on closing prices, and the hypothesis of a price rebound was not met. However, volatility did not immediately jump to historically high levels upon the breach. Therefore, the next points to watch are whether the price will find support near $3,900 or whether it can recover the $4,000 level early on. Even if a rebound occurs, if $4,000 becomes resistance, the correction is not yet complete.
③ Investor Activity
CFTC Money Manager net positions totaled 105,562 contracts, an increase of 1,356 contracts from the previous week. This represents a shift from the previous week, which saw a decrease of 3,898 contracts concurrent with price declines. Despite a 2.82% decrease in gold prices, the increase in net long positions suggests that at least some speculators viewed the decline as an opportunity to reinstate positions rather than a signal to cover short positions.
However, the level itself is not overheated. Net positions are at the 42.31 percentile over the past 1 year, and 24.36 percentile over the past 3 years. Looking primarily at the past 3 years, which indicate a long-term positioning, speculative positions are light, and room remains for a resumption of the uptrend. If the price recovers above $4,000 next week and net longs also increase, the credibility of re-entry will rise, but if positions decrease along with a price decline, we would judge this week’s increase as a temporary contrarian move.
④ Macro Factors Check
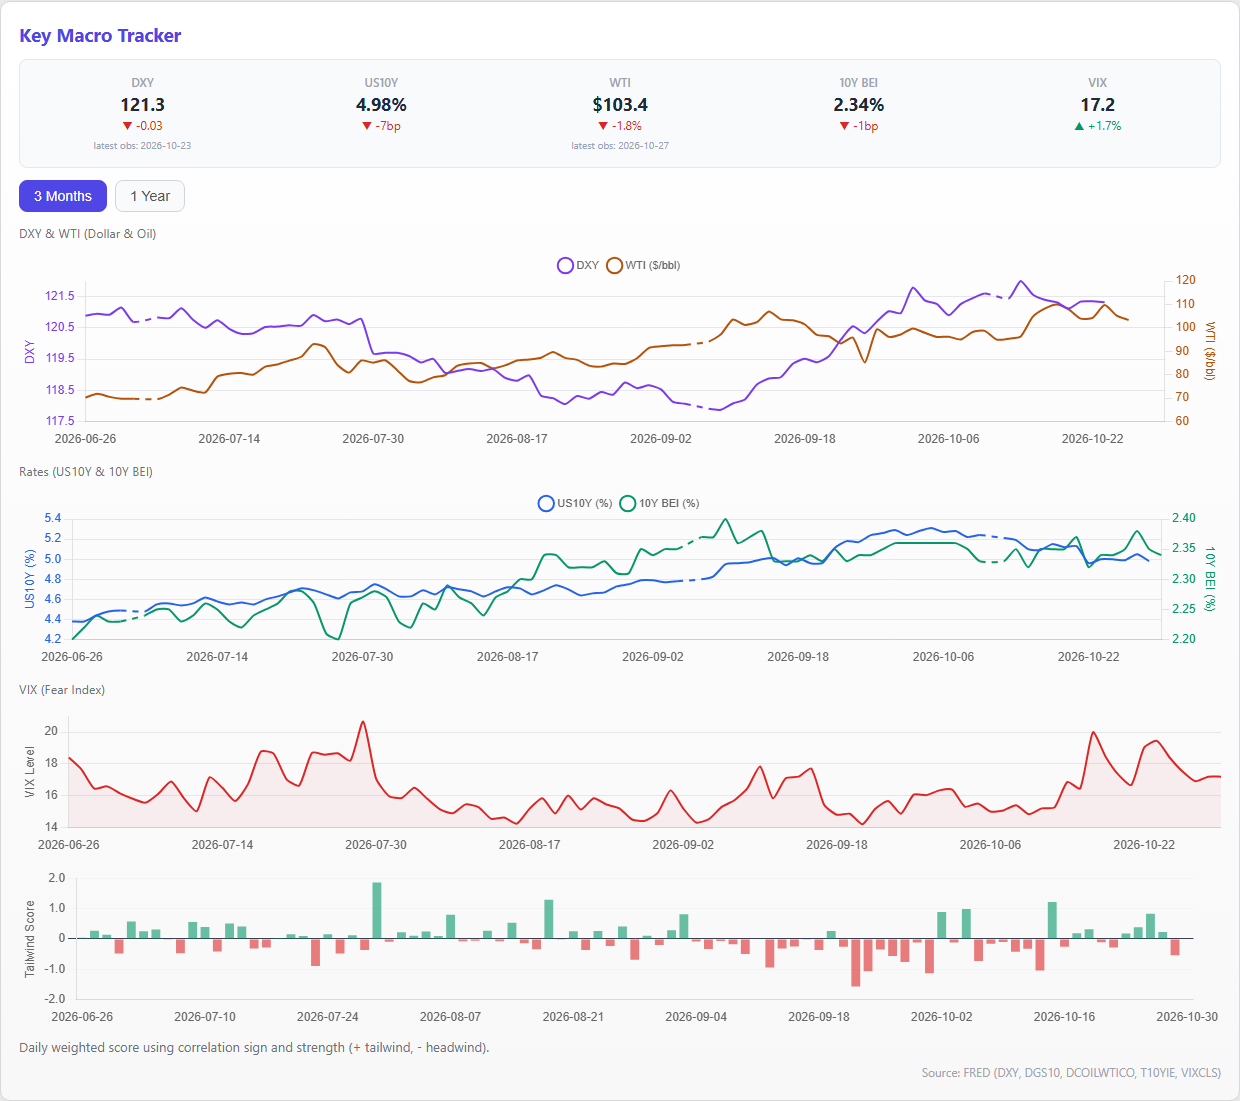
Gold has both headwinds and tailwinds. The US 10-year nominal interest rate is 4.98%, the 10-year BEI is 2.34%, and the difference, representing a proxy for real interest rates, was 2.63%. This is down from 2.76%, as confirmed in last week’s article, and such a change tends to support gold prices. Nevertheless, the price fell, meaning that this week, the decline in real interest rates alone was not enough to halt the adjustment.
Meanwhile, the dollar index is at 121.3202, the 90.98th percentile over the past year, and the strong dollar continues to be a burden on gold. The VIX is at 17.2, near the 51.95th percentile over the past year, suggesting a lack of strong safe-haven buying due to widespread fear. WTI is at $103.37, the 96.37th percentile over the past 3 years, and U.S. high-yield OAS was at 3.26%, the 95.02nd percentile over the past year. While inflationary pressures and nascent credit concerns could be supporting materials for gold in the medium term, high nominal interest rates and the dollar are currently suppressing gains in the short term. Rather than deciding direction based on individual indicators, we want to confirm whether "real interest rates will continue to decline" and "the dollar will deviate from its high-price range" in combination.
⑤ Supply and Demand and Sentiment
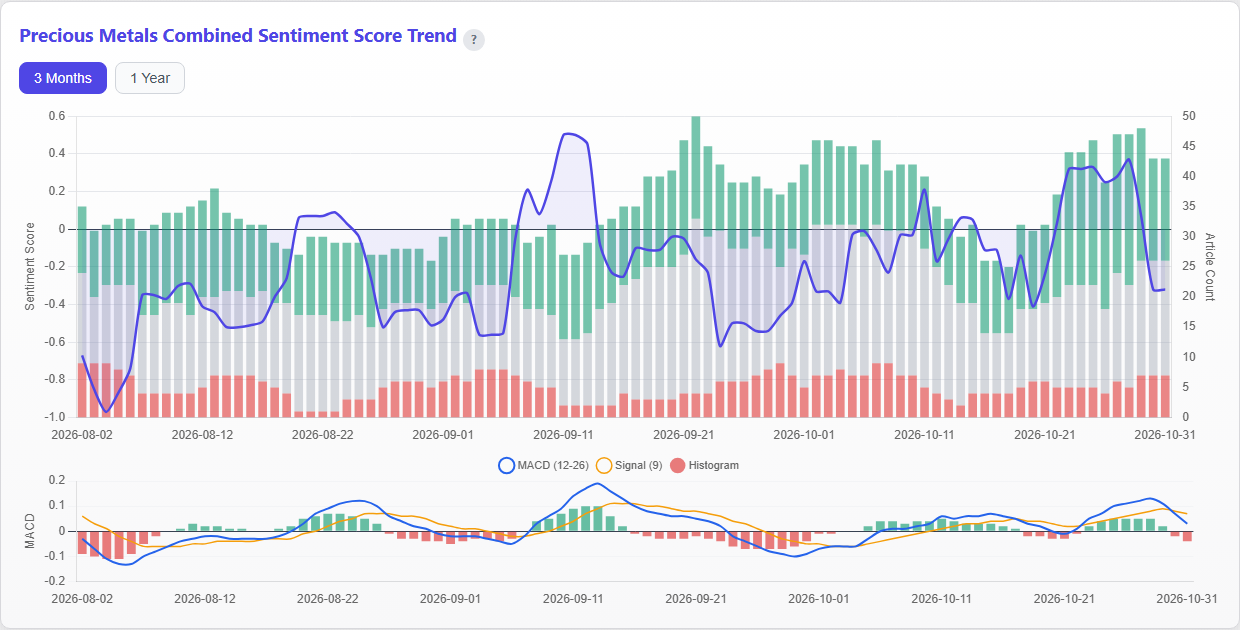
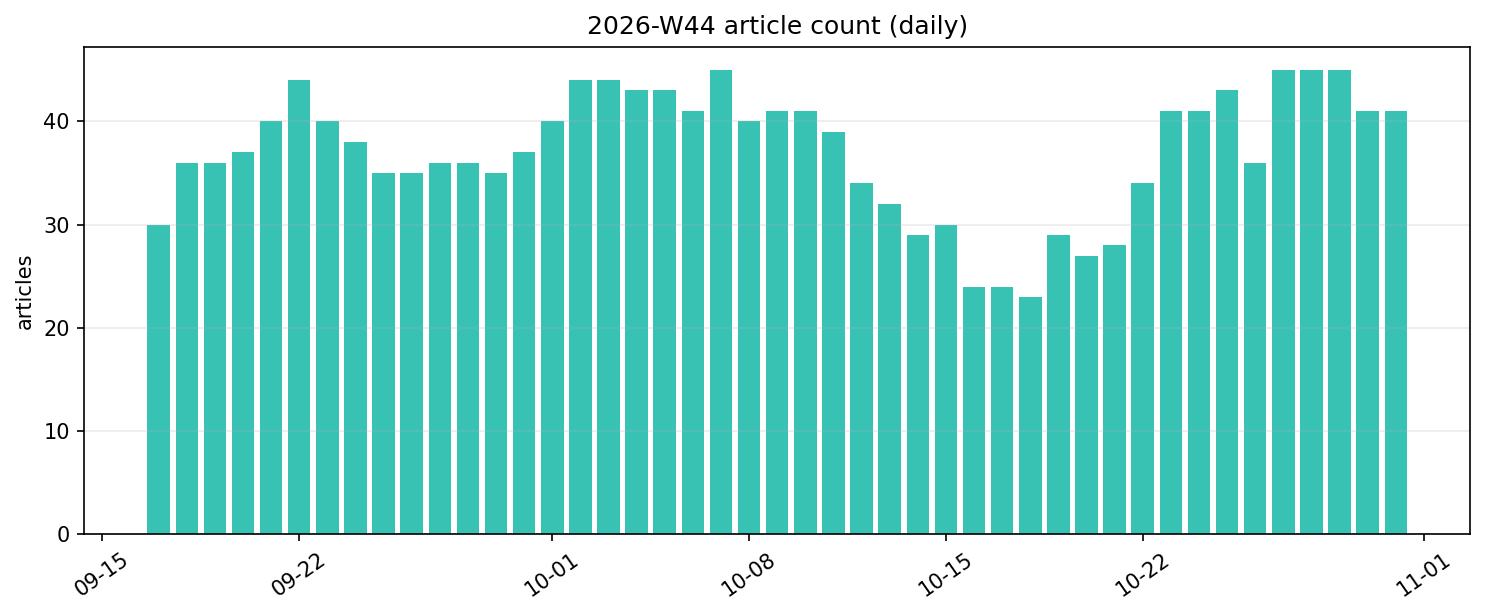
This week’s gold-related articles totaled 42. The primary indicator, site-adjusted sentiment, improved to a weekly average of +0.3017, although the most recent value was -0.10. While positive factors increased throughout the week, caution returned by the end of the week, and sentiment has not shifted straightforwardly to a bullish stance. The auxiliary indicator’s raw score is a weekly average of +0.23272, but it includes media-specific biases and should not be the primary basis for judgment.
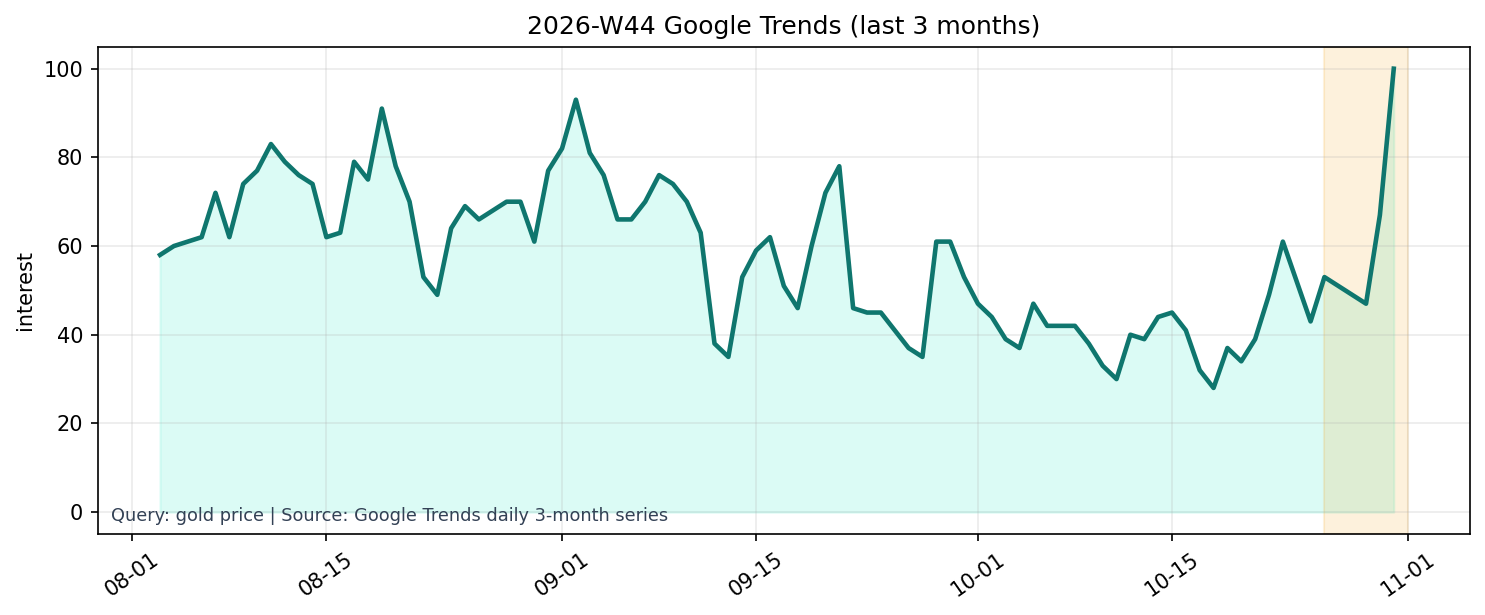
Source: Google Trends daily 3-month series (gold price).
Google Trends data for "gold price" showed a 3-month series value of 100 and a 1-year series value of 25. Short-term search interest rose to its upper limit, increasing from 79 the previous week. The 1-year series also rose from 18 to 25 the previous week, indicating a broadening of interest beyond a temporary increase in searches. However, increased search interest does not directly reflect buying demand. Search activity can also increase due to concerns about price declines or loss confirmation; therefore, it can only be assessed as reflecting strong demand and evaluating price strength in conjunction with COT increases and price rebounds.
Source: Stooq end-of-day spot close series (xauusd / xagusd).
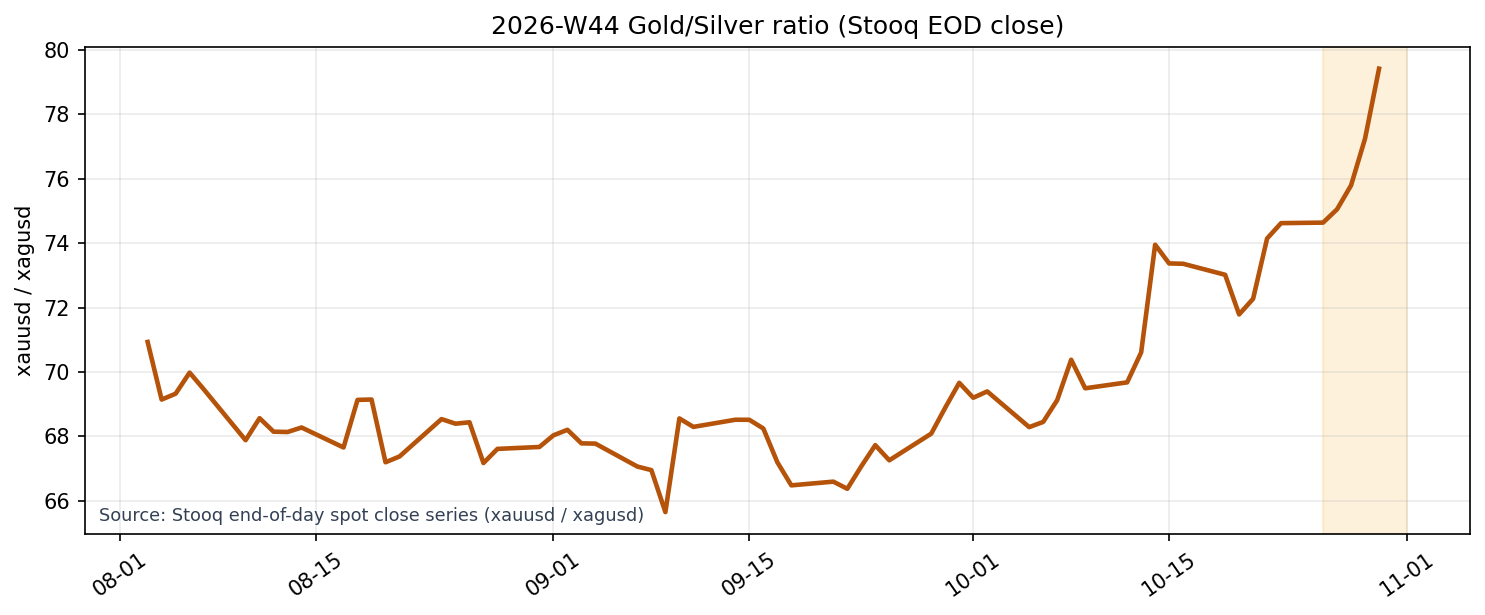
The gold-silver ratio was 79.41, the 37.02 percentile over the past 3 years, and the gold-WTI ratio was 39.42, the 42.40 percentile. Neither is in an extreme position within the long-term distribution, and it cannot be said that gold is significantly deviating from other assets. Regarding supply and demand, the key is to determine whether we are in the initial stage of interest and open interest returning after a period of adjustment, rather than being in a state of being excessively bought due to speculation.
⑥ This Week’s Insights and Next Week’s Highlights
Last week featured a combination of price decline, COT decrease, and increased short-term search interest. This week, while prices continued to fall, COT increased, and the adjusted sentiment weekly average improved clearly to a positive level. What remains unchanged is that the area around $4,000 is an important boundary, and the dollar and real interest rates influence the direction of gold. What has changed is the potential emergence of participants who are not only following selling but are also beginning to support prices at lower levels.
Next week, we will track three conditions. First, can the price maintain around $3,900 and recover to above $4,000 by the close? If it recovers, there is a high probability that this week's decline was a short-term dip. Second, will Money Manager net longs increase further from 105,562 contracts? Overlapping price recovery and COT (Commitment of Traders) increases will make it easier to assess the sustainability of the rebound. Third, will the real interest rate proxy fall from 2.63% and will the dollar index move away from its one-year high? If these two conditions are met, the macro headwinds for gold will ease.
Conversely, if the price falls below $3,900, COT decreases, and real interest rates rise again, this week's psychological improvement will be a false expectation. A bottoming-out cannot be definitively confirmed at this point. However, the bearish sentiment of last week, which stated that "if the price falls, everything will worsen," has been broken. Next week, we want to wait until two or more of price, positions, and macro factors move in the same direction.