Gold prices rebounded 4.8%, with a divergence in the uptrend indicated by COT reduction and deteriorating sentiment.
① One-sentence summary for this week:
Gold recovered to $4,000, while the long-short ratio (COT) and news sentiment retreated. This week will determine whether price-led bounces transition into sustained gains with investor conviction.
② Price Trends and Chart Review
Gold began the week at $3,890.00 and finished at $4,074.90. The weekly change was plus 4.75%. The range from the low of $3,889.00 to the high of $4,155.80 was $266.80, reaching 6.86% from the opening price. The level rose from last week’s closing price of $3,898.90, and the condition observed last week – “defend $3,900 and recover $4,000” – has been achieved.
However, price movements have not been gentle. The 20-day realized volatility was 23.50% annualized, placing it at the 55.34 percentile over the past year. While not in an extreme overbought zone, ignoring the week's ups and downs and focusing only on the closing price risks overlooking the instability of the rebound. The 3-month return is negative 7.80%, and the 1-year return is positive 1.77%, making it difficult to judge that this week’s rise has ended the medium-term adjustment.
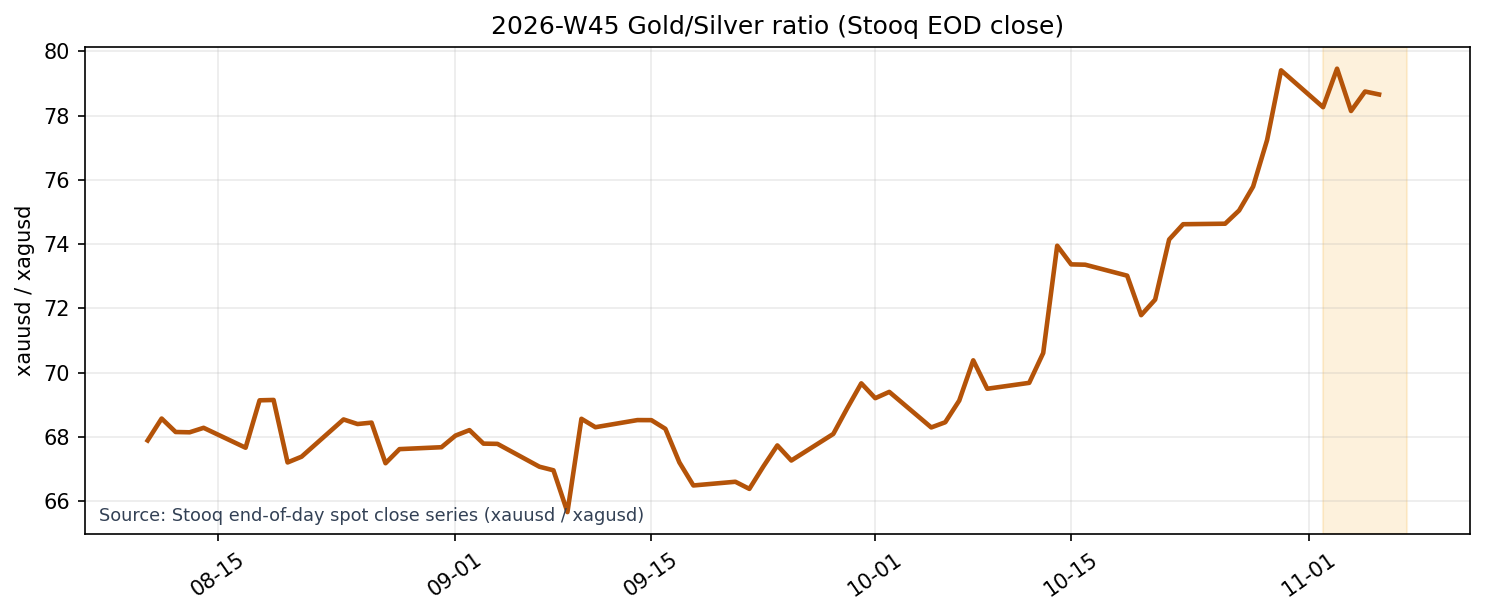
Source: Stooq end-of-day spot close series (xauusd / xagusd).
Weekly prices are based on the futures series in the input data. Spot prices used with the gold/silver ratio below are based on Stooq’s end-of-day closing prices. The gold/silver ratio is 78.66, a 0.95% decrease from the previous week’s 79.41. This movement suggests a shift where funds are flowing into silver, rather than a sole rise in gold.
③ Investor Activity
As of November 3rd, the CFTC COT report showed that Money Managers’ net long position was 103,614 contracts. This consisted of 122,283 contracts bought and 18,669 contracts sold, a net position that decreased by 1,948 contracts from the previous week. A notable divergence this week is that speculative net buying did not increase despite a week in which prices rose by 4.75%.
Last week, while prices fell, buy-covering increased to 105,562 shares, indicating absorption of the decline. This week, although price conditions improved, we were unable to confirm an increase in COT. Therefore, it is more likely that prices rebounded while existing positions were maintained, rather than institutional investors actively chasing an uptrend.
Open interest totals 399,169 contracts. The short covering ratio remains at the 36.54 percentile over the past 1 year, indicating limited overheating due to consolidation. However, having buying power available and actual buying activity are separate matters. Next week, we will want to confirm whether net buying will again exceed 105,562 contracts, or at the very least, whether the decline will stop.
④ Macro Factors Check
Gold was supported by a slight decline in U.S. interest rates and a sharp rise in market anxiety. The yield on U.S. 10-year Treasury notes fell from 4.90% to 4.84%, and the proxy value for real interest rates fell from 2.64% to 2.60%. This eased the pressure of holding costs for gold, which does not generate interest. A basic explanation of the relationship between gold prices and real interest rates/the dollar can be found here.
Meanwhile, the dollar index was at 121.67, a slight decrease of 0.06% week-on-week, and remains at a high level corresponding to the 97.13 percentile over the past year. The upward pressure on the dollar has not been resolved. The breakeven inflation rate was almost unchanged at 2.24% to 2.23%, suggesting that inflation expectations have not strongly pushed up gold prices.
Notable was the VIX, which rose 69.66% from 16.61 to 28.18, and the high-yield bond OAS, which widened from 3.32 to 3.48. Crude oil was slightly lower at $99.64. This week’s gold rebound likely resulted from a simultaneous effect of risk aversion and falling interest rates, rather than optimism regarding the economy or inflation.
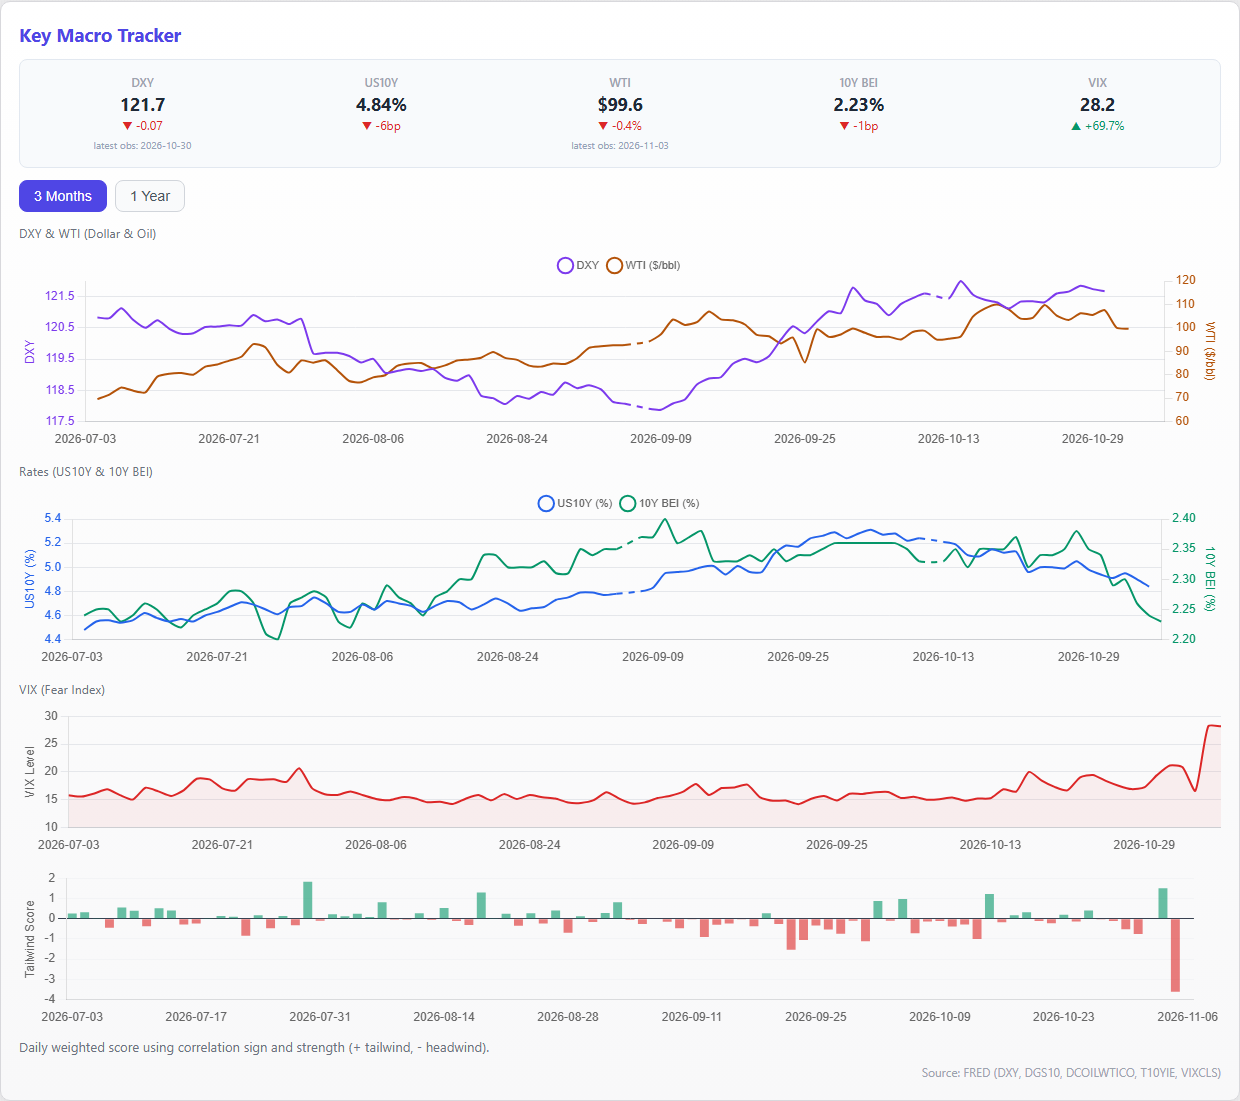
Source: weekly input dataset; DXY, U.S. rates, VIX, WTI and credit spread snapshots.
⑤ Supply and Demand and Sentiment
Site-adjusted sentiment, based on 36 news items, averaged negative 0.316 for the week, with the most recent value at negative 0.23. This represents a clear deterioration from the previous week’s average of positive 0.302. This week, news optimism did not fuel a buying market, as price increases and article sentiment moved in opposite directions.
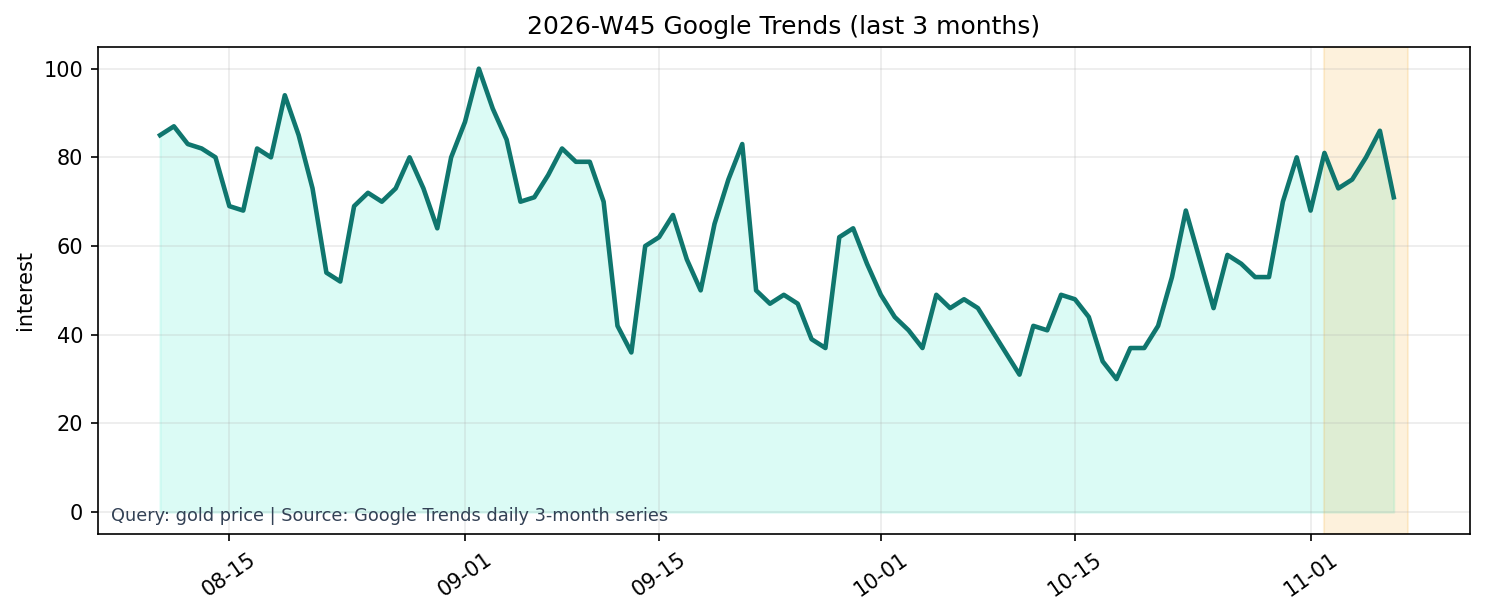
Source: Google Trends daily 3-month series (gold price).
Google Trends' "gold price" search interest decreased 17.44% to a current 3-month value of 71, down from 86 the previous week. Conversely, the weekly value for the 1-year series is 33, up 26.92% from 26 the previous week. Short-term search interest has cooled off from its peak, but interest is beginning to return on a longer time horizon. Due to the differing frequencies of data collection for these two series, we treat the numbers as directional changes rather than absolute comparisons.
News sentiment, search interest, and Commitment of Traders (COT) data do not indicate broad bullishness. Nevertheless, the price recovering to $4,000 demonstrates absorption of selling pressure despite lingering pessimism. Rather than asserting strength in supply and demand, it is more appropriate to characterize this as a "rebound leaving room for improvement in sentiment.
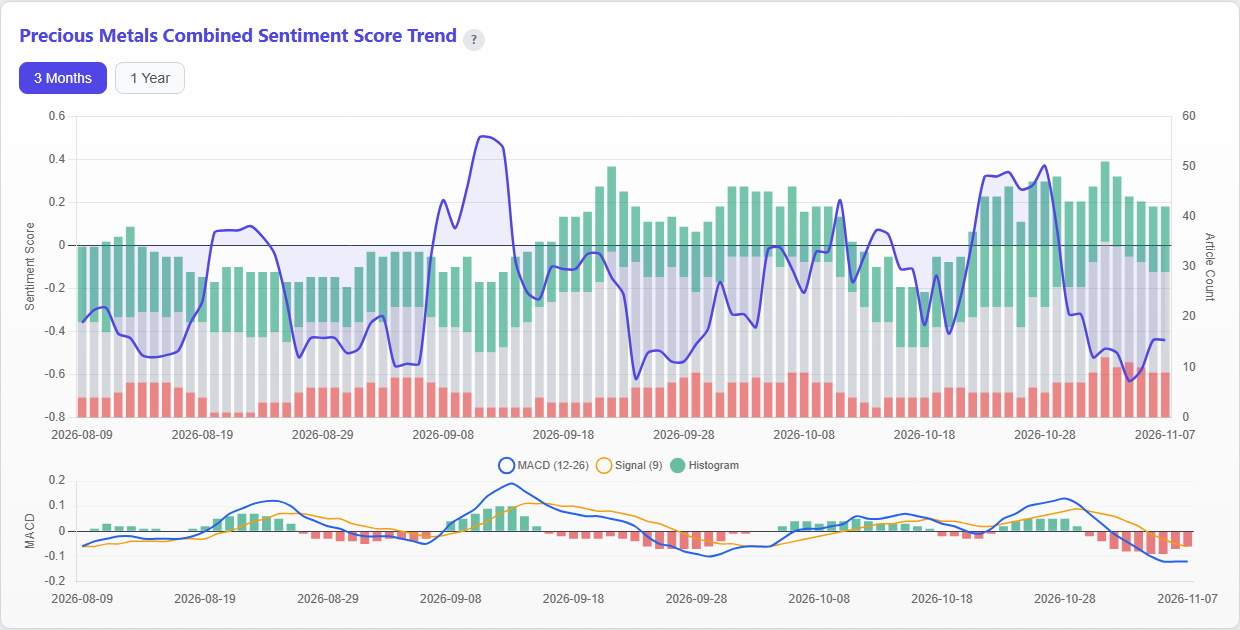
Source: site-corrected article sentiment and Google Trends snapshots.
⑥ This Week’s Insights and Next Week’s Key Points
This week’s finding is that prices are strong, but participant conviction has not caught up. Last week was an absorption phase of “price decline/COT increase,” but this week has shifted to a combination of “price increase/COT decrease/deteriorating sentiment.” The first phase of the rebound has proceeded solely on price action, and institutional investor and news sentiment have not yet confirmed it.
In a bullish scenario, the first condition is to maintain $4,000 as a closing price and exceed the weekly high of $4,155.80. If this is accompanied by a halt in the decrease of COT buying, a decline of the real interest rate proxy value to below 2.60%, and a narrowing of the negative width of site-adjusted sentiment, it will be easier to judge that the rebound has shifted to a rise accompanied by positions.
A neutral scenario involves consolidation within a range of $3,900 to $4,155, with COT and sentiment providing a base. In this case, this week's rise would represent price discovery after an adjustment, but it will take time to confirm the direction.
A bearish scenario would involve a retest below $4,000, and further downside to $3,889. A continuation of Commitment of Traders (COT) buying excesses, a rebound in real interest rates above 2.64%, and a weakening of safe-asset demand due to a decline in the VIX could suggest that this week’s rebound was temporary.
Next week, I will be looking at whether price, COT data, and market sentiment align in the same direction, rather than focusing solely on the price itself. I will not declare a bullish trend based on maintaining the $4,000 level alone, but will prioritize confirming whether buyer participation can be verified through numerical data.
X-targeted titles: Gold rebounds 4.8%, COT and sentiment diverge
Recommended Hashtags: #ThinkingAboutMoney #RecentLessons #GoldPrice #Gold #PreciousMetalInvestment